
性能日志用于统计应用的启动速度、卡顿与卡死等情况。您可以在移动分析控制台的 基础分析 页面查看启动速度指标;在 性能分析 页面中查看卡顿与卡死报告。
支持基于 mPaaS 框架和原生工程进行日志埋点。
基于 mPaaS 框架
卡顿监控默认对 10% 的设备开启,可通过下面这个接口设置卡顿开启率。
[MPAnalysisHelper setLagMonitorPercent: 100]; // 100% 监控,需要在 startPerformanceMonitor 调用之前设置卡顿监控只有在真机上并且非 Xcode 调试状态下是打开的。
在启动时调用
[MPAnalysisHelper startPerformanceMonitor],推荐在-(void)application:(UIApplication *)application beforeDidFinishLaunchingWithOptions:(NSDictionary *)launchOptions方法中调用。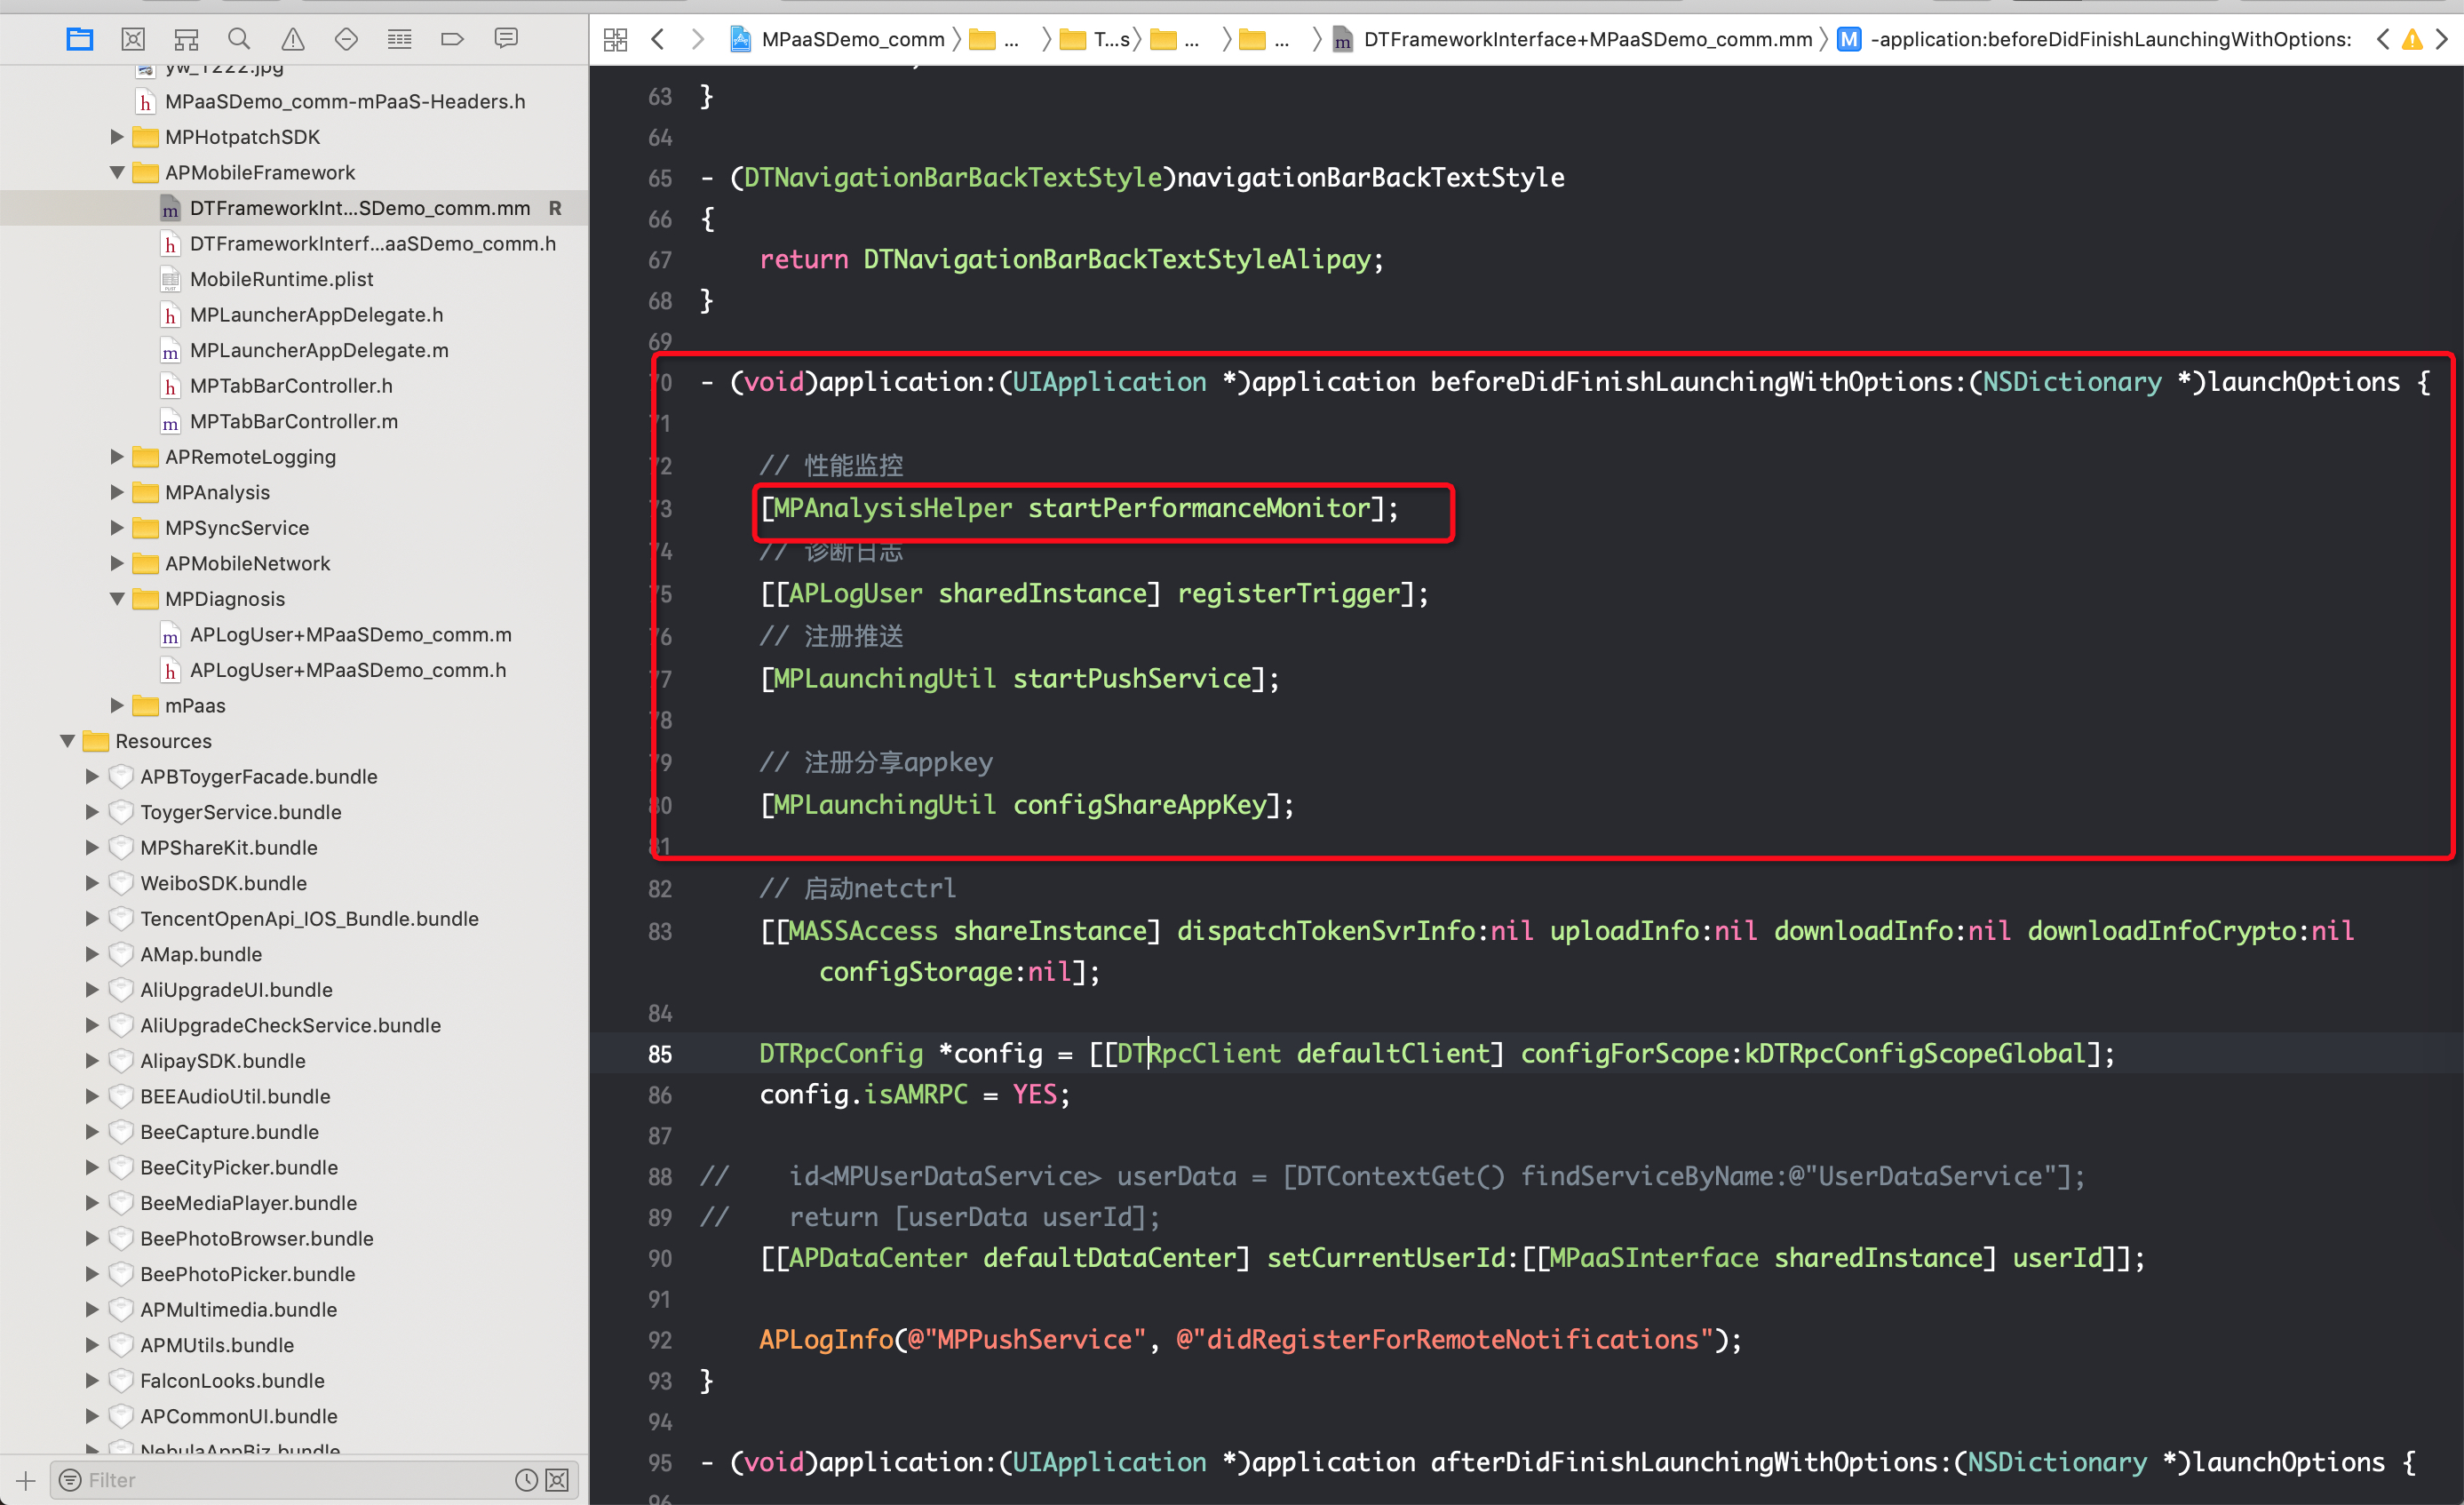
基于原生工程
SDK 封装了性能监控接口,推荐您在 AppDelegate 的 - (BOOL)application:(UIApplication )application didFinishLaunchingWithOptions:(NSDictionary )launchOptions 方法中调用 [PerformanceHelper performanceMonitor]。
    #import "PerformanceHelper.h"
    #import <MPAnalysis/MPAnalysisHelper.h>

    static NSTimeInterval __start_timestamp = 0;

    @implementation PerformanceHelper

    + (void)load
    {
        __start_timestamp = CFAbsoluteTimeGetCurrent();
    }

    + (void)performanceMonitor
    {
        //start performance monitor

       [MPAnalysisHelper setLagMonitorPercent: 100]; // 100% 监控,需要在 startPerformanceMonitor 调用之前设置
        [MPAnalysisHelper startPerformanceMonitor];

        //record the time interval used for the app startup
        NSTimeInterval time = CFAbsoluteTimeGetCurrent() - __start_timestamp;
        [[MPAnalysisHelper sharedInstance] writeLogForStartupWithTime:time];

    }

    @end
卡顿监控只有在真机上并且非 Xcode 调试状态下是打开的。
自定义设置性能监控阈值
当默认的性能监控阈值无法满足您的需求时,可以自定义设置相关阈值。
设置卡顿阈值
#引入头文件
#import <MPMasAdapter/MPAnalysisHelper.h>

/**
 设置主线程卡顿监控的阈值,单位秒,可不设置,默认值为2秒
 */
+ (void)setLagTimeThreshold:(NSUInteger)threshold;

/**
 设置卡顿检测的间隔时长, 建议 lagTimeThreshold / lagCheckInterval 等于整数
 */
+ (void)setLagCheckInterval:(NSTimeInterval)interval;
设置卡死阈值
#import <MPMasAdapter/MPMasSettings.h>

#创建 MPMasSettings 分类,重写下面方法做自定义


/**
 获取卡死时长阈值,需自定义时在Category中重写,建议 anrTimeThreshold / anrCheckInterval 等于整数
 */
- (NSUInteger)anrTimeThreshold
{
    return 自定义的时长;
}


/**
 获取卡死检测间隔时长,需自定义时在Category中重写,建议 anrTimeThreshold / anrCheckInterval 等于整数
 */
- (NSTimeInterval)anrCheckInterval
{
    return 自定义的检测间隔时长;
}
设置启动卡死时长阈值
#import <MPMasAdapter/MPMasSettings.h>

#创建 MPMasSettings 分类,重写下面方法做自定义


/**
 获取启动卡死时间阈值,需自定义时在Category中重写
 */
- (NSUInteger)startupAnrTimeThreshold
{
    return 自定义的时长;
}该文章对您有帮助吗?