本文介绍如何通过部署 OBCloud Exporter 和 Prometheus 进行 OceanBase 云数据库的监控。
背景信息
OBCloud Exporter 是云数据库 OceanBase 提供的一款数据库数据处理工具,可通过该工具完成 OceanBase 数据库的鉴权和数据获取。再结合本地 Prometheus 工具对数据库进行相应的监控。
下文通过系统直接部署和通过 docker 部署两种方式说明相应的工具使用方法。
前提条件
已部署 Java 8 及以上的运行环境。
已完成 Docker 部署。
已完成 kubectl 相关工具部署。
系统运行 Prometheus 监控 OceanBase 云数据
下载 OBCloud Exporter。
说明目前 OBCloud Exporter 暂未放开直接下载,可联系技术支持人员获取。
部署 OBCloud Exporter。
解压 OBCloud Exporter 安装包,安装目录为
/opt/obcloud-exporter。mkdir /opt/obcloud-exporter unzip Obcloud_Exporter.zip -d /opt/obcloud-exporter解压后目录包含如下文件:
Dockerfile:Docker 容器构建文件。
muticloud_metric_config.yaml:指标配置文件,此文件默认不需要修改。
application.yaml:采集配置文件。
obcloud-exporter-1.0-SNAPSHOT-jar-with-dependencies.jar:OBCloud Exporter 程序。
readme.md:项目说明。
编辑配置文件 application.yaml。
aliyun_monitor:
  ## 身份凭据
  credential:
    access_key_id: xxx
    access_key_secret: xx
    region_id: ap-southeast-1
    end_point: xxx
  metric_meta_auto_refresh: false
  default_metric:
    - sql_all_rt
    - sql_delete_rt
  ## 实例信息
  instances:
    instance_id: xxx
    tenant_id: xxx
    instance_type: cluster
    metrics:
      - sql_all_rt
      - sql_delete_rt
参数说明:
参数名称
是否必填
参数描述
示例值
access_key_id
是
鉴权信息,访问 我的账号 > AccessKey 获取,可在对应平台申请。具体操作,请参见,创建AccessKey。
************
access_key_secret
是
鉴权信息,访问 我的账号 > AccessKey 获取,可在对应平台申请。具体操作,请参见,创建AccessKey。
************
region_id
是
地域信息,请参见 公有云服务区域说明。
ap-southeast-1
end_point
是
终端地址,请参见 公有云服务区域说明。
oceanbasepro.ap-southeast-1.aliyuncs.com
metric_meta_auto_refresh
否
是否定时刷新 metric 指标,默认为 false。
false
default_metric
否
默认指标,当没有配置 instances 指定采集的实例和指标时,可通过 default_metric 控制账号下所有实例采集指定的指标。
- sql_all_rt
instance_id
否
集群实例 ID 或租户实例 ID。可包含多个集群、租户实例,通过短划线(-)并列填入。
ob************
tenant_id
否
查询集群下指定租户,需配置 tenant_id, instance_type=cluster 时可以不配置。
当实例为租户实例时,需 instance_id 和 tenant_id 都配置相同的实例 ID,并且指定 instance_type 为 tenant。
t************
instance_type
否
实例类型:
cluster:集群主机维度监控指标,并且会自动采集集群下所有租户的监控数据。
tenant:租户数据库维度指标。
tenant
metrics
否
指标信息,默认为采集全部指标。具体指标清单,请参见本文 监控指标清单 章节。
说明采集指标过多可能会影响采集速度,适当情况下拆分为多个 exporter。
- sql_all_rt
通过 Java 运行 OBCloud Exporter。
可以通过如下命令,指定配置文件启动 OBCloud Exporter。
java -Dconfig=/xx/application.yaml -jar obcloud-exporter-1.0-SNAPSHOT-jar-with-dependencies.jar --spring.config.location=/xx/application.properties-Dconfig:(可选)指定监控配置文件启动。
--spring.config.location:(可选)程序默认集成并开启了 SpringBoot 的 actuator 组件,默认端口为 8082,实际使用中也可以自行配置,根据实际配置的地址端口进行访问。默认配置为:
server.port=-1
management.server.port=8082
management.endpoints.web.exposure.include=health,info
management.endpoint.health.show-details=always
常见示例:
# 默认配置启动 OBCloud Exporter
java -jar obcloud-exporter-1.0-SNAPSHOT-jar-with-dependencies.jar
# 指定环境配置变量启动 OBCloud Exporter
java -jar obcloud-exporter-1.0-SNAPSHOT-jar-with-dependencies.jar --spring.config.location=/xx/application.properties
# 指定监控配置文件启动 OBCloud Exporter
java -Dconfig=/xx/application.yaml -jar obcloud-exporter-1.0-SNAPSHOT-jar-with-dependencies.jar
# 同时指定监控配置文件和环境变量配置启动 OBCloud Exporter
java -Dconfig=/xx/application.yaml -jar obcloud-exporter-1.0-SNAPSHOT-jar-with-dependencies.jar --spring.config.location=/xx/application.properties
通过浏览器验证部署结果,访问对应 IP 地址的 9400 端口,确认是否获取到监控数据。
说明实际使用中,根据实际配置的地址端口进行访问。
下载 Prometheus 软件,在官网找到所需版本的 Prometheus 安装包,进行下载,如下以 2.50.1 的 Linux 版本为例。
wget https://github.com/prometheus/prometheus/releases/download/v2.50.1/prometheus-2.50.1.linux-amd64.tar.gz部署 Prometheus。
解压并安装 Prometheus 软件,安装目录为
/opt/prometheus。mkdir -p /opt/prometheus tar -zxvf prometheus-2.50.1.linux-amd64.tar.gz -C /opt/prometheus --strip-components=1转移配置文件 prometheus.yml 到工作目录,并根据需要进行编辑。
mv /opt/prometheus/prometheus.yml /usr/local/bin/
vi /usr/local/bin/prometheus.yml
修改如下参数:
global:
  scrape_interval: 30s
  scrape_timeout: 20s

scrape_configs:
  - job_name: "nodes"
    static_configs:
    - targets: ['localhost:9400']
新建 Prometheus 服务文件和相关数据存储目录。
mkdir /var/lib/prometheus/
sudo vim /etc/systemd/system/Prometheus.service
填写如下内容并保存。
说明User(用户)和 Group(用户组)参数是可选的,设置方法请参考下一步骤 设置用户名和用户组。
[Unit]
Description=Prometheus
Wants=network-online.target
After=network-online.target

[Service]
User=prometheus
Group=prometheus
Restart=on-failure
ExecStart=/opt/prometheus/prometheus \
      --config.file /usr/local/bin/prometheus.yml \
      --storage.tsdb.path /var/lib/prometheus/

[Install]
WantedBy=multi-user.target
(可选)设置用户名和用户组,上一步骤中配置已有的用户/用户组或者没有配置,可忽略此步骤。
sudo groupadd prometheus
sudo useradd -r -g prometheus prometheus
sudo chown -R prometheus:prometheus /opt/prometheus /var/lib/prometheus
sudo chmod -R 755 /opt/prometheus /var/lib/prometheus
启动 Prometheus 服务。
# 加载新的 systemd 配置
sudo systemctl daemon-reload

# 启动 Prometheus 服务
sudo systemctl start prometheus

# 设置开机启动
sudo systemctl enable prometheus

# 检查服务状态
sudo systemctl status prometheus
确认 Prometheus 是否启动成功。
sudo netstat -ntlp | grep 9090
通过 docker 部署 prometheus 监控 OceanBase 云数据库
下载 OBCloud Exporter。
说明目前 OBCloud Exporter 暂未放开直接下载,可联系技术支持人员获取。
部署 OBCloud Exporter。
解压 OBCloud Exporter 安装包,安装目录为
/opt/obcloud-exporter。mkdir /opt/obcloud-exporter unzip Obcloud_Exporter.zip -d /opt/obcloud-exporter解压后目录包含如下文件:
Dockerfile:Docker 容器构建文件。
muticloud_metric_config.yaml:指标配置文件,此文件默认不需要修改。
application.yaml:采集配置文件。
obcloud-exporter-1.0-SNAPSHOT-jar-with-dependencies.jar:OBCloud Exporter 程序。
readme.md:项目说明。
编辑配置文件 application.yaml。
aliyun_monitor:
  ## 身份凭据
  credential:
    access_key_id: xxx
    access_key_secret: xx
    region_id: ap-southeast-1
    end_point: xxx
  metric_meta_auto_refresh: false
  default_metric:
    - sql_all_rt
    - sql_delete_rt
  ## 实例信息
  instances:
    instance_id: xxx
    tenant_id: xxx
    instance_type: cluster
    metrics:
      - sql_all_rt
      - sql_delete_rt
参数说明:
参数名称
是否必填
参数描述
示例值
access_key_id
是
鉴权信息,访问 我的账号 > AccessKey 获取,可在对应平台申请。具体操作,请参见,创建AccessKey。
************
access_key_secret
是
鉴权信息,访问 我的账号 > AccessKey 获取,可在对应平台申请。具体操作,请参见,创建AccessKey。
************
region_id
是
地域信息,请参见 公有云服务区域说明。
ap-southeast-1
end_point
是
终端地址,请参见 公有云服务区域说明。
oceanbasepro.ap-southeast-1.aliyuncs.com
metric_meta_auto_refresh
否
是否定时刷新 metric 指标,默认为 false。
false
default_metric
否
默认指标,当没有配置 instances 指定采集的实例和指标时,可通过 default_metric 控制账号下所有实例采集指定的指标。
- sql_all_rt
instance_id
否
集群实例 ID 或租户实例 ID。可包含多个集群、租户实例,通过短划线(-)并列填入。
ob************
tenant_id
否
查询集群下指定租户,需配置 tenant_id, instance_type=cluster 时可以不配置。
当实例为租户实例时,需 instance_id 和 tenant_id 都配置相同的实例 ID,并且指定 instance_type 为 tenant。
t************
instance_type
否
实例类型:
cluster:集群主机维度监控指标,并且会自动采集集群下所有租户的监控数据。
tenant:租户数据库维度指标。
tenant
metrics
否
指标信息,默认为采集全部指标。具体指标清单,请参见本文 监控指标清单 章节。
说明采集指标过多可能会影响采集速度,适当情况下拆分为多个 exporter。
- sql_all_rt
通过 Docker 启动 OBCloud Exporter。
在
/opt/obcloud-exporter目录下,构建 obcloud-exporter 容器。cd /opt/obcloud-exporter docker build -t obcloud-exporter:1.0 .启动容器或者映射外部配置文件启动。
直接启动 Docker 容器
docker run -itd -p9400:9400 --name obcloud-exporter obcloud-exporter:1.0通过映射外部配置文件启动 Docker 容器。
docker run -itd -p9400:9400 -v /opt/obcloud-exporter/application.yaml:/app/application.yaml --name obcloud-exporter obcloud-exporter:1.0
通过浏览器验证部署结果,访问对应 IP 地址的 9400 端口,确认是否获取到监控数据。
说明实际使用中,根据实际配置的地址端口进行访问。
创建 Prometheus 配置文件 prometheus.yml。
vi /usr/local/bin/prometheus.yml编辑配置文件内容:
global:
  scrape_interval: 30s
  evaluation_interval: 30s

scrape_configs:
  - job_name: obcloud-exporter-test
    static_configs:
        # 本地服务器加端口
      - targets: ['obcloud-exporter:9400']
        labels:
          instance: obcloud-exporter
启动 Prometheus 服务。
 docker run  -d \
   -p 9090:9090 \
   -v /usr/local/bin/prometheus.yml:/etc/prometheus/prometheus.yml  \
   --link obcloud-exporter  \
   --name prometheus \
   prom/prometheus
确认 Prometheus 是否启动成功。
sudo netstat -ntlp | grep 9090
通过 kubenetes 部署 Prometheus 监控 OceanBase 数据库
下载 OBCloud Exporter。
说明目前 OBCloud Exporter 暂未放开直接下载,可联系技术支持人员获取。
解压 OBCloud Exporter 安装包,安装目录为
/opt/obcloud-exporter。mkdir /opt/obcloud-exporter unzip Obcloud_Exporter.zip -d /opt/obcloud-exporter解压后目录包含如下文件:
Dockerfile:Docker 容器构建文件。
muticloud_metric_config.yaml:指标配置文件,此文件默认不需要修改。
application.yaml:采集配置文件。
obcloud-exporter-1.0-SNAPSHOT-jar-with-dependencies.jar:OBCloud Exporter 程序。
readme.md:项目说明。
打包并上传 OBCloud Exporter 的镜像文件。
在
/opt/obcloud-exporter目录下,构建 obcloud-exporter 容器。cd /opt/obcloud-exporter docker build -t obcloud-exporter:1.0 .登录云厂商镜像仓库,下文以阿里云镜像库为例,实际使用中根据个人需要修改。
docker login registry.cn-hangzhou.aliyuncs.com
Username: ****@test.com
Password:
将镜像名称改成对应的镜像仓库名。
docker tag obcloud-exporter:1.0 registry.cn-hangzhou.aliyuncs.com/obcloud-exporter:1.0docker push 上传到镜像仓库。
docker push registry.cn-hangzhou.aliyuncs.com/obcloud-exporter:1.0
在本地编辑配置文件 deployment.yml。
创建配置文件 deployment.yml。
vi /opt/obcloud-exporter/deployment.yml编辑配置文件:
apiVersion: v1
kind: ConfigMap
metadata:
  name: exporter-config
  namespace: default
  labels: {}
  annotations: {}
data:
  application.yaml: |
    ## 监控名称
    aliyun_monitor:
      ## 身份凭据
      credential:
        access_key_id: xxx
        access_key_secret: xx
        region_id: ap-southeast-1
        ## 终端地址
        end_point: xxx
      ## 是否定时刷新metric指标,默认为false(目前仅支持阿里云)
      metric_meta_auto_refresh: false
      ## 默认指标,当没有配置instances自动获取实例时,可通过default_metric指定采集的指标
      default_metric:
        - sql_all_rt
        - sql_delete_rt
      instances:
        - ## 实例id
          instance_id: xxx
          ## 实例类型:cluster集群主机维度监控指标(包含tenant维度), tenant租户数据库维度指标.
          instance_type: cluster
          ## 指定采集的指标
          metrics:
            - sql_all_rt
            - sql_delete_rt
        - ## 实例id
          instance_id: xxx
          ## 查询集群下指定租户,需配置tenant_id, instance_type=cluster时可不配。
          ## 当实例为租户实例时,需instance_id和tenant_id都配置相同的实例id,并且指定instance_type为tenant
          tenant_id: xxx
          ## 实例类型:cluster集群主机维度监控指标(包含tenant维度), tenant租户数据库维度指标.
          instance_type: tenant
          ## 指定采集的指标
          metrics:
            - sql_all_rt
            - sql_delete_rt
    ## 监控名称
    muti_monitor:
      ## 身份凭据
      credential:
        access_key_id: xxx
        access_key_secret: xx
        ## 终端地址
        end_point: xxx
        ## 是否定时刷新metric指标,默认为false(目前仅支持阿里云)
        metric_meta_auto_refresh: false
      instances:
        - ## 实例id
          instance_id: xxx
          ## 查询集群下指定租户,需配置tenant_id, instance_type=cluster时可不配。
          ## 当实例为租户实例时,需instance_id和tenant_id都配置相同的实例id,并且指定instance_type为tenant
          tenant_id: xxx
          ## 实例类型:cluster集群主机维度监控指标(包含tenant维度), tenant租户数据库维度指标.
          instance_type: tenant
          metrics:
            - sql_all_rt
            - sql_delete_rt
---
apiVersion: apps/v1
kind: Deployment
metadata:
  name: obcloud-exporter
  namespace: default
spec:
  replicas: 1
  selector:
    matchLabels:
      app: obcloud-exporter
  template:
    metadata:
      labels:
        app: obcloud-exporter
    spec:
      containers:
        - name: exporter
          image: registry.cn-hangzhou.aliyuncs.com/obcloud-exporter:1.0
          env:
          - name: TZ
            value: "Asia/Shanghai"  # 设置时区
          command: ["java", "-jar", "/app/obcloud-exporter.jar"]
          imagePullPolicy: IfNotPresent
          livenessProbe:
            httpGet:
              path: /actuator/health
              port: 8082
            initialDelaySeconds: 15
            periodSeconds: 20
          readinessProbe:
            httpGet:
              path: /
              port: 9400
            initialDelaySeconds: 5
            periodSeconds: 10
          volumeMounts:
            - name: config-volume
              mountPath: /app/application.yaml
              subPath: application.yaml
      volumes:
        - name: config-volume
          configMap:
            name: exporter-config
---
apiVersion: v1
kind: Service
metadata:
  name: exporter-service
  namespace: default
spec:
  selector:
    app: obcloud-exporter
  ports:
    - protocol: TCP
      port: 9400
      targetPort: 9400
  type: ClusterIP
参数说明:
参数名称
是否必填
参数描述
示例值
access_key_id
是
鉴权信息,访问 我的账号 > AccessKey 获取,可在对应平台申请。具体操作,请参见,创建AccessKey。
************
access_key_secret
是
鉴权信息,访问 我的账号 > AccessKey 获取,可在对应平台申请。具体操作,请参见,创建AccessKey。
************
region_id
是
地域信息,请参见 公有云服务区域说明。
ap-southeast-1
end_point
是
终端地址,请参见 公有云服务区域说明。
oceanbasepro.ap-southeast-1.aliyuncs.com
metric_meta_auto_refresh
否
是否定时刷新 metric 指标,默认为 false。
false
default_metric
否
默认指标,当没有配置 instances 指定采集的实例和指标时,可通过 default_metric 控制账号下所有实例采集指定的指标。
- sql_all_rt
instance_id
否
集群实例 ID 或租户实例 ID。可包含多个集群、租户实例,通过短划线(-)并列填入。
ob************
tenant_id
否
查询集群下指定租户,需配置 tenant_id, instance_type=cluster 时可以不配置。
当实例为租户实例时,需 instance_id 和 tenant_id 都配置相同的实例 ID,并且指定 instance_type 为 tenant。
t************
instance_type
否
实例类型:
cluster:集群主机维度监控指标,并且会自动采集集群下所有租户的监控数据。
tenant:租户数据库维度指标。
tenant
metrics
否
指标信息,默认为采集全部指标。具体指标清单,请参见本文 监控指标清单 章节。
说明采集指标过多可能会影响采集速度,适当情况下拆分为多个 exporter。
- sql_all_rt
保存并更新部署文件后,运行以下命令来应用修改:
kubectl apply -f /opt/obcloud-exporter/deployment.yml
创建 Prometheus 配置文件 prometheus.yml。
vi /opt/obcloud-exporter/prometheus.yml编辑配置文件内容:
apiVersion: v1
kind: ConfigMap
metadata:
  name: prometheus-config
  namespace: default
data:
  prometheus.yaml: |
    global:
      scrape_interval: 60s
      scrape_timeout: 55s
    scrape_configs:
    - job_name: "exporter"
      static_configs:
      - targets: ['exporter-service:9400']
---
apiVersion: apps/v1
kind: Deployment
metadata:
  name: prometheus
  namespace: default
spec:
  selector:
    matchLabels:
      app: prometheus
  template:
    metadata:
      labels:
        app: prometheus
    spec:
      volumes:
        - name: config-volume
          configMap:
            name: prometheus-config
      containers:
        - image: prom/prometheus:v2.35.0
          name: prometheus
          args:
            - "--config.file=/etc/prometheus/prometheus.yaml"
            - "--storage.tsdb.path=/prometheus" # 指定tsdb数据路径
            - "--storage.tsdb.retention.time=15d"
            - "--web.enable-lifecycle" # 支持热更新,直接执行localhost:30000/-/reload立即生效
          ports:
            - containerPort: 9090
              name: http
          securityContext:
            runAsUser: 0
          volumeMounts:
            - mountPath: "/etc/prometheus"
              name: config-volume
---
apiVersion: v1
kind: Service
metadata:
  name: prometheus
  namespace: default
spec:
  selector:
    app: prometheus
  type: NodePort
  ports:
    - name: web
      port: 9090
      nodePort: 30000 #默认开启节点的 30000 端口
      targetPort: http
启动 Prometheus 服务。
kubectl apply -f /opt/obcloud-exporter/prometheus.yml
通过 Prometheus 查看数据库监控
通过浏览器访问 Prometheus 服务地址:http://localhost:9090/targets,查看相应的监控信息。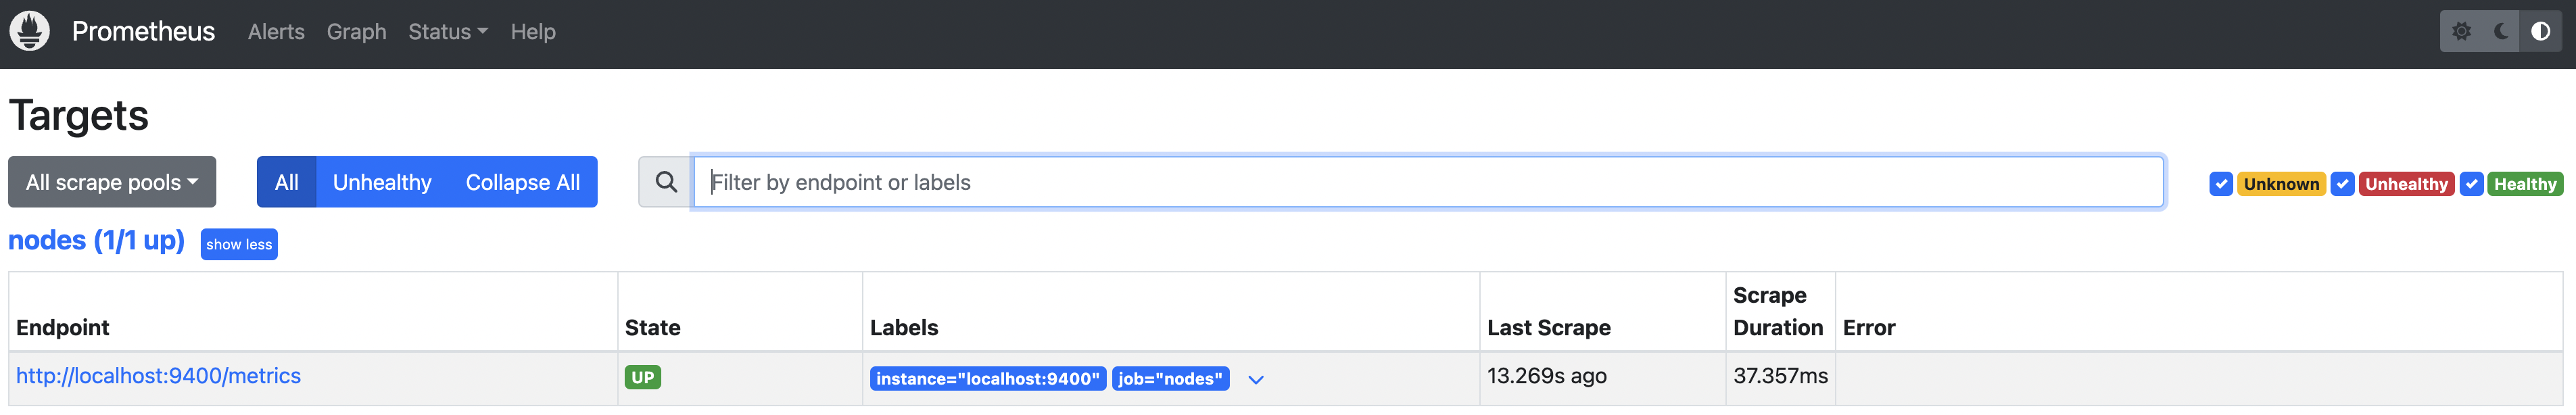
配置示例
建议根据实际需求配置监控指标,以确保任务执行效率,避免过多指标影响采集效率。
动态获取账号下实例
采集指定指标
## 监控名称
monitor:
  ## 身份凭据
  credential:
    access_key_id: xxx
    access_key_secret: xx
    region_id: ap-southeast-1
    ## 终端地址
    end_point: xxx
  metric_meta_auto_refresh: false
  ## 默认指标,当没有配置instances自动获取实例时,可通过 default_metric 指定采集的指标
  default_metric:
    - sql_all_rt
    - sql_delete_rt
采集所有指标
## 监控名称
monitor:
  ## 身份凭据
  credential:
    access_key_id: xxx
    access_key_secret: xx
    region_id: ap-southeast-1
    ## 终端地址
    end_point: xxx
  metric_meta_auto_refresh: false
采集账号下指定的集群
采集指定的指标,可根据实际情况选择 instance_type。
## 监控名称
monitor:
  ## 身份凭据
  credential:
    access_key_id: xxx
    access_key_secret: xx
    region_id: ap-southeast-1
    end_point: xxx
  metric_meta_auto_refresh: false
  instances:
      instance_id: xxx
      tenant_id: xxx
      instance_type: tenant
      metrics:
        - sql_all_rt
        - sql_delete_rt
采集所有指标,instance_type 值设定为 cluster 时,可同时采集集群的主机指标和租户数据库指标。
## 监控名称
monitor:
  ## 身份凭据
  credential:
    access_key_id: xxx
    access_key_secret: xx
    region_id: ap-southeast-1
    end_point: xxx
  metric_meta_auto_refresh: false
  instances:
      instance_id: xxx
      instance_type: cluster
采集租户数据库所有指标,instance_type 值设定为 tenant 时,只采集指定租户的租户数据库指标。
## 监控名称
monitor:
  ## 身份凭据
  credential:
    access_key_id: xxx
    access_key_secret: xx
    region_id: ap-southeast-1
    end_point: xxx
  metric_meta_auto_refresh: false
  instances:
      instance_id: xxx
      tenant_id: xx
      instance_type: tenant
采集多个账号
## 监控名称
aliyun:
  ## 身份凭据
  credential:
    access_key_id: xxx
    access_key_secret: xx
    region_id: ap-southeast-1
    end_point: xxx
  metric_meta_auto_refresh: false
muti:
  ## 身份凭据
  credential:
    access_key_id: xxx
    access_key_secret: xx
    end_point: xxx
监控指标清单
集群主机
采集项名称 | 采集项说明 | 采集项单位 |
load1 | 过去1分钟系统平均负载 | - |
load5 | 过去5分钟系统平均负载 | - |
load15 | 过去15分钟系统平均负载 | - |
cpu_percent | CPU 使用率 | % |
memory_buffers | 内核 Buffer Cache 大小 | GB |
memory_cached | 缓存使用的内存 | GB |
memory_free | 可用物理内存大小 | GB |
memory_used | 使用物理内存大小 | % |
net_recv | 每秒接收数据量 | MB |
net_send | 每秒发送数据量 | MB |
net_throughput | 网络吞吐率 | MB |
ntp_offset_milliseconds | ntp时钟偏移 | ms |
ob_data_disk_percent | OB 数据盘使用率 | % |
ob_clog_disk_percent | OB 日志盘使用率 | % |
ob_data_disk_used_size | 磁盘使用量 | GB |
ob_process_exists | OB进程存活状态 | - |
ob_clog_io | OB 日志盘平均每秒 IO 次数 | times/s |
ob_clog_io_read | OB 日志盘平均每秒读 IO 次数 | times/s |
ob_clog_io_write | OB 日志盘平均每秒写IO 次数 | times/s |
ob_clog_io_read_time | OB 日志盘平均每次读 IO 耗时 | ms |
ob_clog_io_time | OB 日志盘平均每次 IO 耗时 | ms |
ob_clog_io_write_time | OB 日志盘平均每次写 IO 耗时 | ms |
ob_clog_io_byte | OB 日志盘平均每秒 IO 数据量 | MB |
ob_clog_io_read_byte | OB 日志盘每秒读 IO 数据量 | MB |
ob_clog_io_write_byte | OB 日志盘每秒写 IO 数据量 | MB |
ob_clog_io_util | OB 日志盘 IO 使用率 | % |
ob_data_io | OB 数据盘平均每秒 IO 次数 | times/s |
ob_data_io_read | OB 数据盘平均每秒读 IO 次数 | times/s |
ob_data_io_write | OB 数据盘平均每秒写 IO 次数 | times/s |
ob_data_io_read_time | OB 数据盘平均每次读 IO 耗时 | ms |
ob_data_io_time | OB 数据盘平均每次 IO 耗时 | ms |
ob_data_io_write_time | OB 数据盘平均每次写 IO 耗时 | ms |
ob_data_io_byte | OB 数据盘平均每秒 IO 数据量 | MB |
ob_data_io_read_byte | OB 数据盘每秒读 IO 数据量 | MB |
ob_data_io_write_byte | OB 数据盘每秒写 IO 数据量 | MB |
ob_data_io_util | OB 数据盘 IO 使用率 | % |
租户数据库
性能与 SQL
采集项名称 | 采集项说明 | 采集项单位 |
sql_all_count | 每秒处理 SQL 语句数 | times/s |
sql_delete_count | 每秒处理 Delete 语句数 | times/s |
sql_insert_count | 每秒处理 Insert 语句数 | times/s |
sql_other_count | DDL, DCL, DTL 等其他语句数 | times/s |
sql_replace_count | 每秒处理 Replace 语句数 | times/s |
sql_select_count | 每秒处理 Select 语句数 | times/s |
sql_update_count | 每秒处理 Update 语句数 | times/s |
sql_all_rt | SQL 语句平均处理耗时 | ms |
sql_delete_rt | Delete 语句平均处理耗时 | ms |
sql_insert_rt | Insert 语句平均处理耗时 | ms |
sql_other_rt | DDL, DCL, DTL 等其他语句平均处理耗时 | ms |
sql_replace_rt | Replace 语句平均处理耗时 | ms |
sql_select_rt | Select 语句平均处理耗时 | ms |
sql_update_rt | Update 语句平均处理耗时 | ms |
p99_sql_all_rt | 99 分位 SQL 语句平均处理耗时 | ms |
active_session | 当前活跃会话数 | - |
all_session | 当前会话数 | - |
sql_distributed_count | 每秒处理分布式执行计划数 | times/s |
sql_local_count | 每秒处理本地执行数 | times/s |
sql_remote_count | 每秒处理远程执行计划数 | times/s |
system_event_internal_total_waits | 每秒内部等待事件次数 | times/s |
system_event_io_total_waits | 每秒 IO 等待事件次数 | times/s |
system_event_latch_total_waits | 每秒 latch 等待事件次数 | times/s |
system_event_other_total_waits | 每秒其他等待事件次数 | times/s |
system_event_row_lock_wait_total_waits | 每秒锁等待事件次数 | times/s |
system_event_sync_rpc_total_waits | 每秒同步 RPC 等待事件次数 | times/s |
wait_event_count | 每秒等待事件次数 | times/s |
system_event_internal_time_waited | 内部等待事件平均耗时 | ms |
system_event_io_time_waited | IO 等待事件平均耗时 | ms |
system_event_latch_time_waited | latch 等待事件平均耗时 | ms |
system_event_other_time_waited | 其他等待事件平均耗时 | ms |
system_event_row_lock_wait_time_waited | 锁等待时间平均耗时 | ms |
system_event_sync_rpc_time_waited | 同步 RPC 等待事件平均耗时 | ms |
wait_event_rt | 等待事件平均耗时 | ms |
request_dequeue_count | 从处理队列出队的请求数量 | times/s |
request_enqueue_count | 进入处理队列的请求数量 | times/s |
request_queue_time | SQL 请求在等待队列中的等待耗时 | μs |
ob_cpu_percent | 租户线程CPU使用率 | - |
memstore_percent | MEMStore使用百分比 | - |
rpc_packet_in_rt | Rpc 收包平均耗时 | μs |
rpc_packet_out_rt | Rpc 发包平均耗时 | μs |
rpc_packet_in | Rpc 收包吞吐量 | byte |
rpc_packet_out | Rpc 发包吞吐量 | byte |
opened_cursors_count | 打开的游标数 | - |
ob_worktime | 数据库工作时间 | s |
ob_foreground_worktime | 数据库前台工作时间 | s |
ob_background_worktime | 数据库后台工作时间 | s |
ob_no_idle_waiting_time | 数据库非空闲等待时间 | s |
ob_foreground_no_idle_waiting_time | 数据库前台非空闲等待时间 | s |
ob_background_no_idle_waiting_time | 数据库后台非空闲等待时间 | s |
slow_sql_count | 慢sql数量 | - |
事务
采集项名称 | 采集项说明 | 采集项单位 |
transaction_commit_count | 每秒提交事务数 | times/s |
transaction_count | TPS | times/s |
transaction_rollback_count | 每秒回滚事务数 | times/s |
transaction_timeout_count | 每秒超时事务数 | times/s |
transaction_commit_rt | 事务平均提交耗时 | ms |
transaction_rollback_rt | 事务平均回滚耗时 | ms |
transaction_rt | 服务端每个事务平均处理时间 | ms |
trans_commit_log_count | 每秒提交的事务日志数 | times/s |
clog_trans_log_total_size | 每秒提交的事务日志大小 | byte |
memstore_write_lock_fail_count | 写锁等待失败次数 | times/s |
memstore_write_lock_succ_count | 写锁等待成功次数 | times/s |
memstore_write_lock_wait_time | 写锁平均等待耗时 | μs |
transaction_multi_partition_count | 每秒分布式事务数 | times/s |
transaction_single_partition_count | 每秒普通事务数 | times/s |
trans_commit_log_sync_rt | 每次事务日志网络同步平均耗时 | ms |
存储与缓存
采集项名称 | 采集项说明 | 采集项单位 |
active_memstore_used | 活跃 MEMStore 大小 | MB |
major_freeze_trigger | 触发合并阈值 | MB |
memstore_limit | MEMStore的limit | MB |
total_memstore_used | MEMStore 总大小 | MB |
io_read_count | SSStore 每秒读次数 | times/s |
io_write_count | SSStore 每秒写次 | times/s |
io_read_rt | SSStore 每次读取平均耗时 | ms |
io_write_rt | SSStore 每次写入平均耗时 | ms |
io_read_size | SSStore 每秒读取数据量 | byte |
io_write_size | SSStore 每秒写入数据量 | byte |
block_cache_size | 块缓存大小 | MB |
bloom_filter_cache_size | bloom filter 缓存大小 | MB |
clog_cache_size | Clog 缓存大小 | MB |
location_cache_size | location 缓存大小 | MB |
plan_cache_size | 执行计划缓存大小 | MB |
row_cache_size | 行缓存大小 | MB |
block_cache_hit_ratio | 块缓存命中率 | - |
bloom_filter_cache_hit_ratio | bloom filter 缓存命中率 | - |
clog_cache_hit_ratio | Clog 缓存命中率 | - |
location_cache_hit_ratio | location 缓存命中率 | - |
plan_cache_hit_ratio | 执行计划缓存命中率 | - |
row_cache_hit_ratio | 行缓存命中率 | - |
block_cache_req_total | 块缓存请求次数 | - |
bloom_filter_cache_req_total | bloom filter 缓存请求次数 | - |
clog_cache_req_total | Clog 缓存请求次数 | - |
location_cache_req_total | location 缓存请求次数 | - |
row_cache_req_total | 行缓存请求次数 | - |
ob_tenant_binlog_disk_used | binlog日志磁盘使用量 | GB |
ob_tenant_memory_percent | OB租户内存使用率 | % |
ob_tenant_log_disk_total_bytes | 日志盘总量 | GB |
ob_tenant_log_disk_used_bytes | 日志盘使用量 | GB |
ob_tenant_server_required_size | 数据占用量 | GB |
ob_tenant_server_data_size | 数据量 | GB |