车道线检测
本实验首先介绍使用VMware文件压缩包的使用方法,随后介绍jupyter notebook中运行的车道线检测代码
场景简介
本实验介绍:
使用VMware文件压缩包的使用方法
jupyter notebook中运行的车道线检测代码
实验室资源方式简介
进入实操前,请确保阿里云账号满足以下条件:
个人账号资源
使用您个人的云资源进行操作,资源归属于个人。
平台仅提供手册参考,不会对资源做任何操作。
确保已完成云工开物300元代金券领取。
已通过实名认证且账户余额≥100元。
本次实验将在您的账号下开通实操所需计算型实例规格族c7a,费用约为:25元(以实验时长2小时预估,具体金额取决于实验完成的时间),需要您通过阿里云云工开物学生专属300元抵扣金兑换本次实操的云资源。
如果您调整了资源规格、使用时长,或执行了本方案以外的操作,可能导致费用发生变化,请以控制台显示的实际价格和最终账单为准。
领取专属权益及创建实验资源
在开始实验之前,请先点击右侧屏幕的“进入实操”再进行后续操作

领取300元高校专属权益优惠券(若已领取请跳过)
实验产生的费用优先使用优惠券,优惠券使用完毕后需您自行承担。

实验步骤
1、服务部署
点击链接,进入部署页面
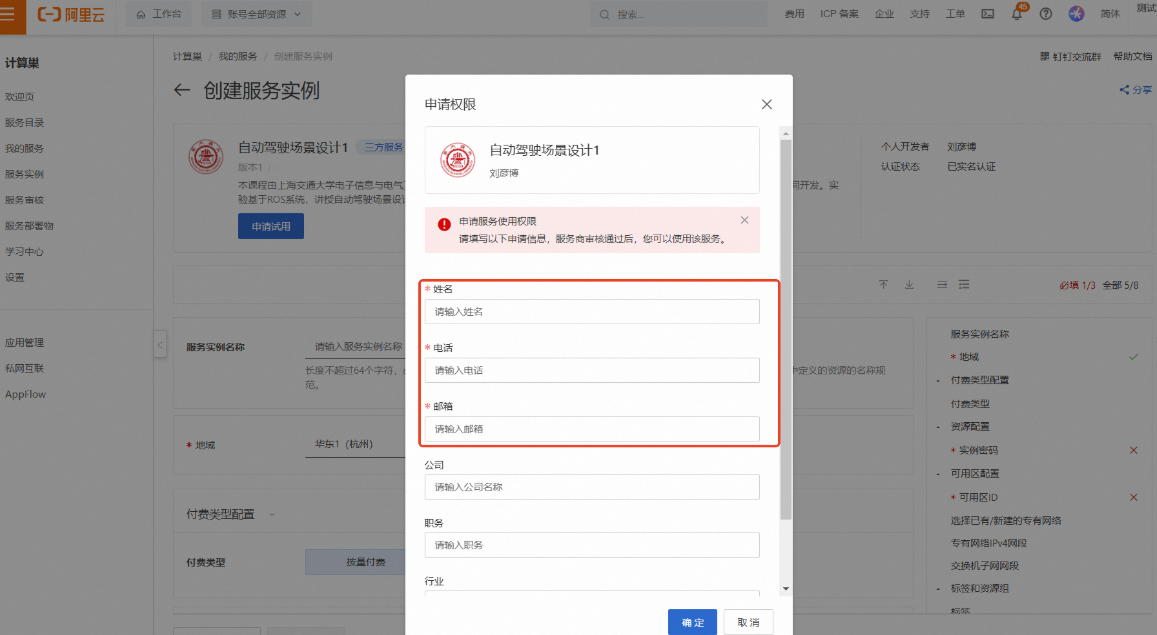
按弹窗提示进行权限申请。其中【姓名】、【电话】、【邮箱】为必填项,完成填写后点击【确定】
说明请填写您的学校邮箱(.edu),便于审核
提交申请后将提示
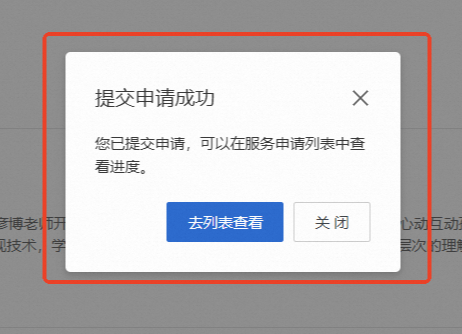
当申请通过后,将会收到短信提示可以进行部署

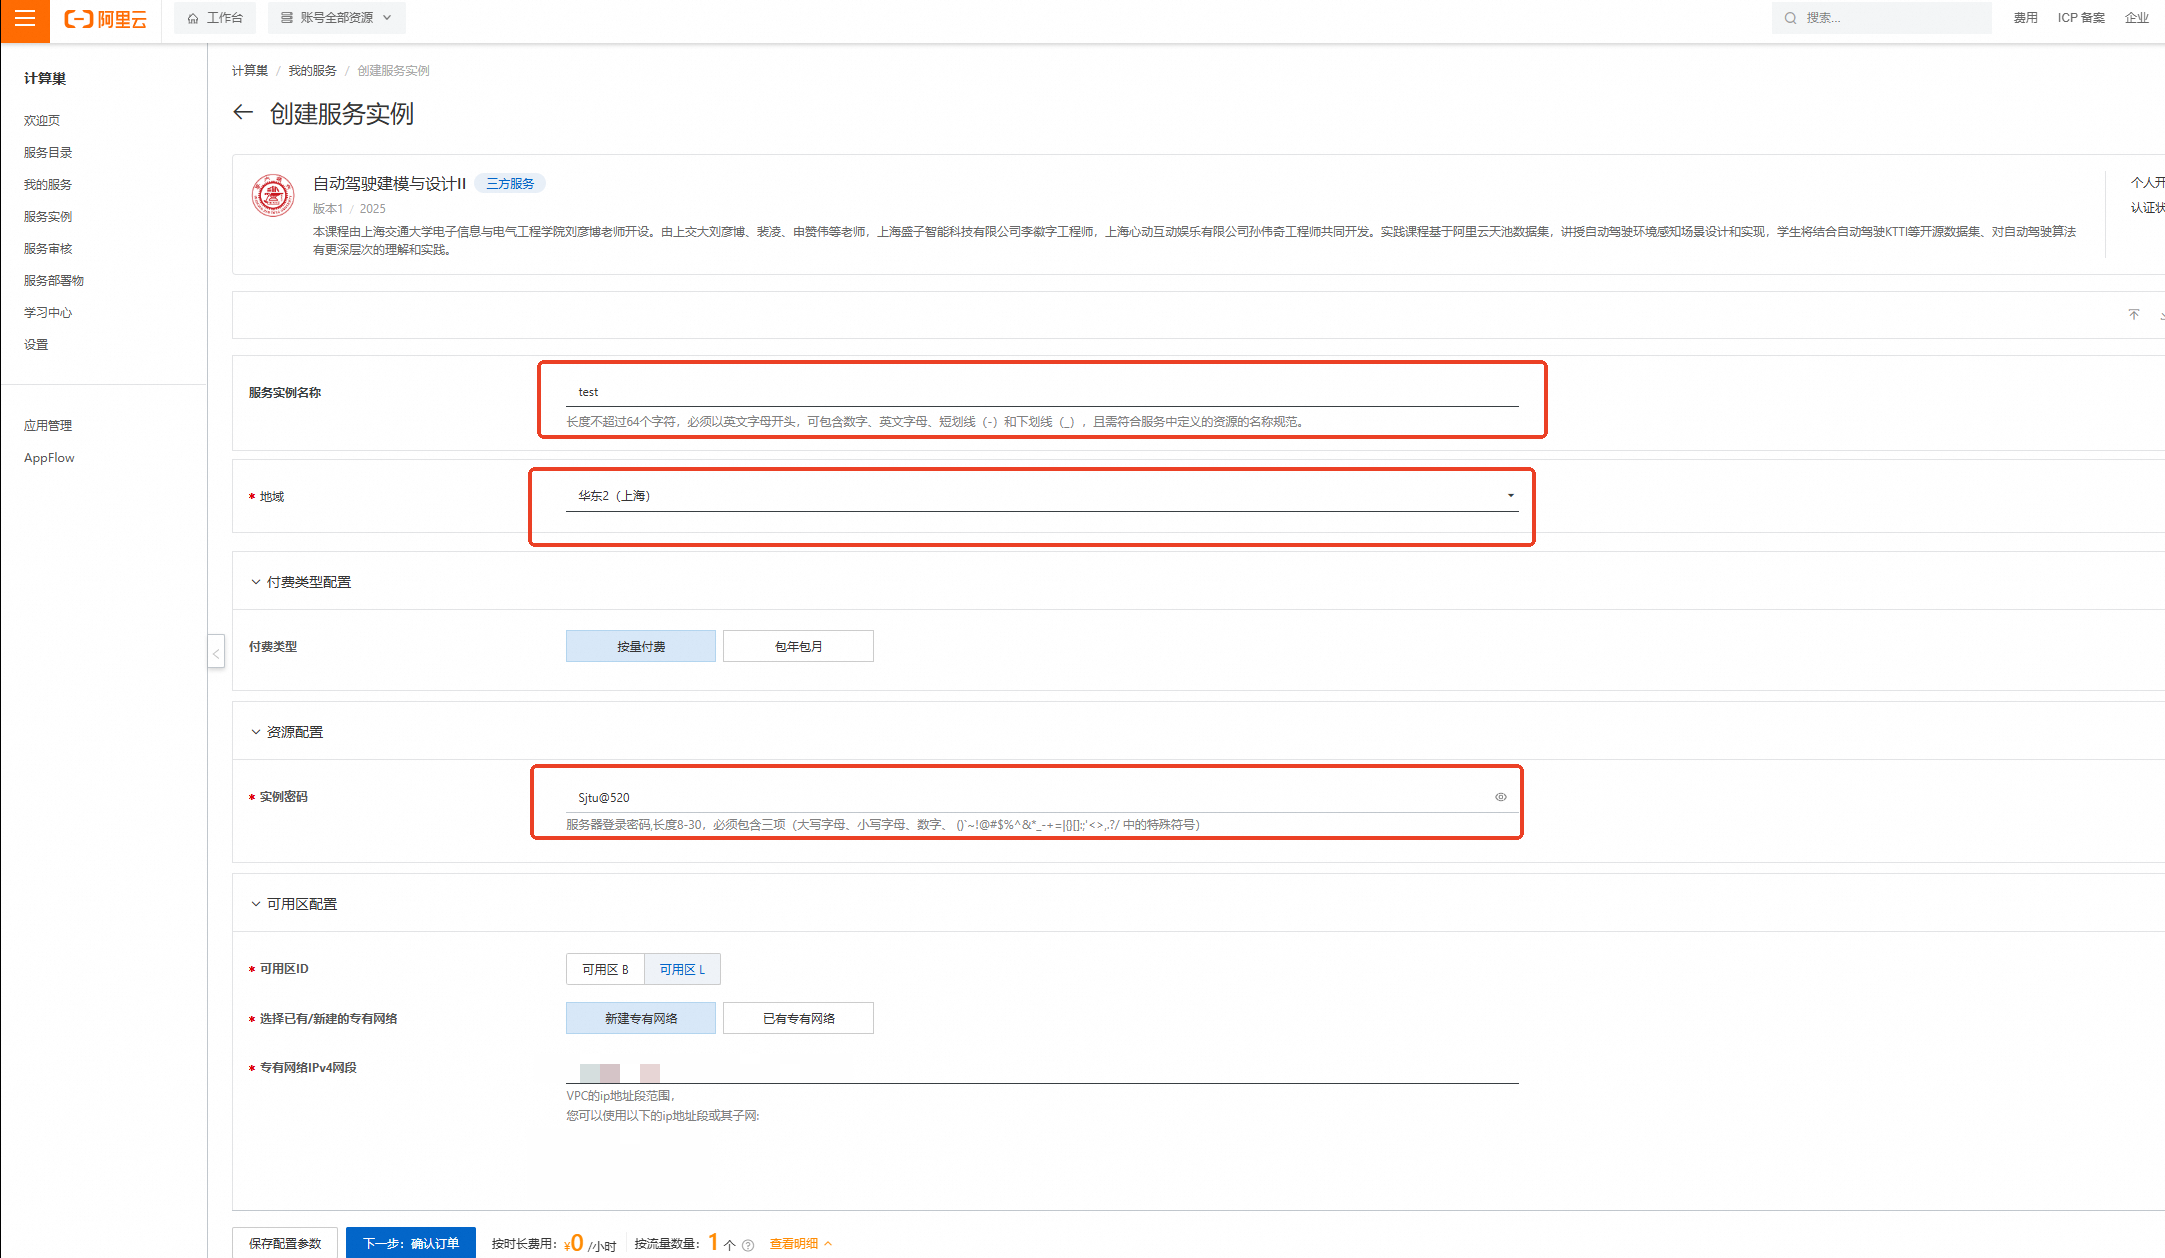
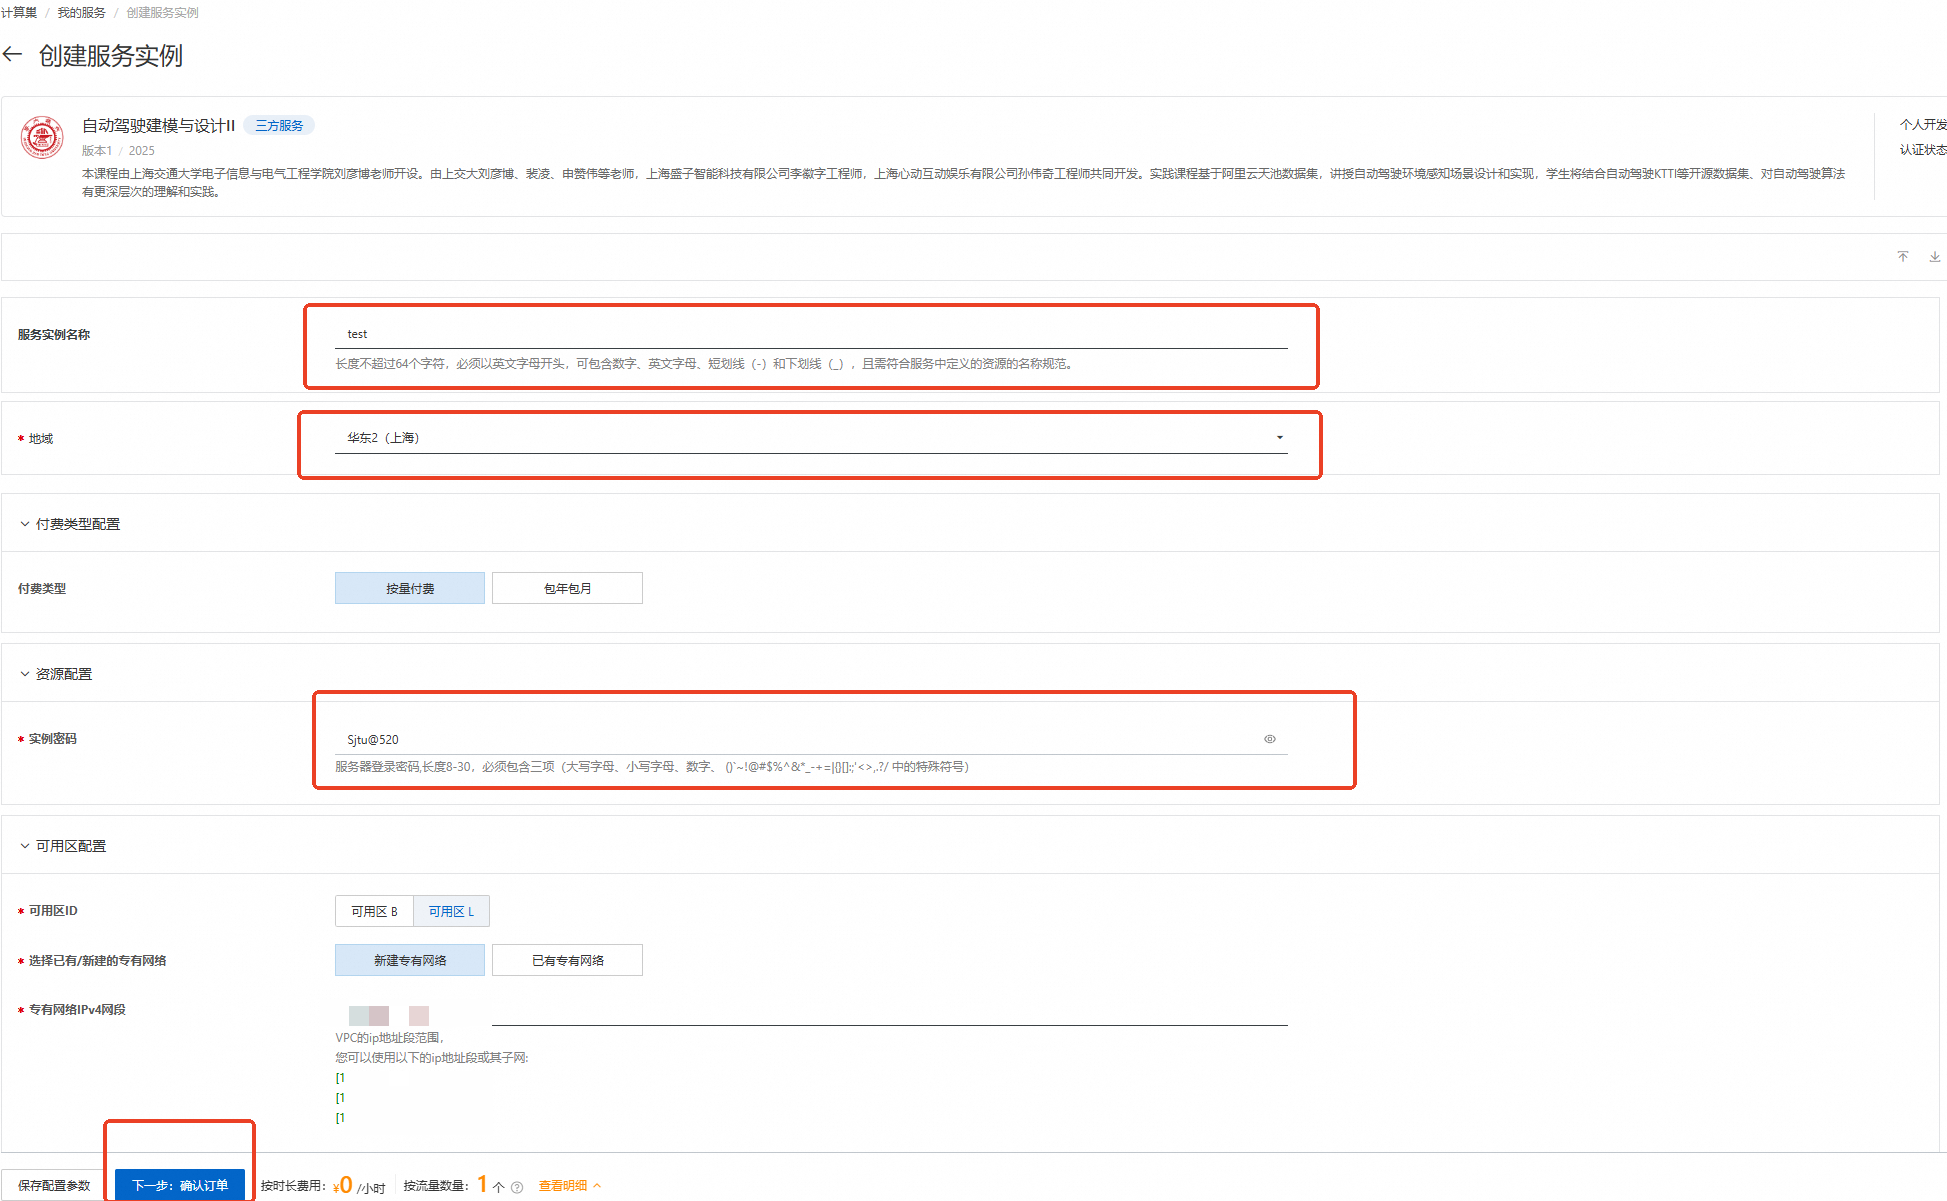
刷新部署页面,按下图设置【服务实例名称】、【地域】、【实例密码】
服务实例名称:test(可自定义命名)
地域:华东2(上海)
实例密码:Sjtu@520
说明输入实例密码时请注意大小写,请记住您设置的实例名称及对应密码,后续实验过程会用到。

完成填写后点击【下一步:确认订单】
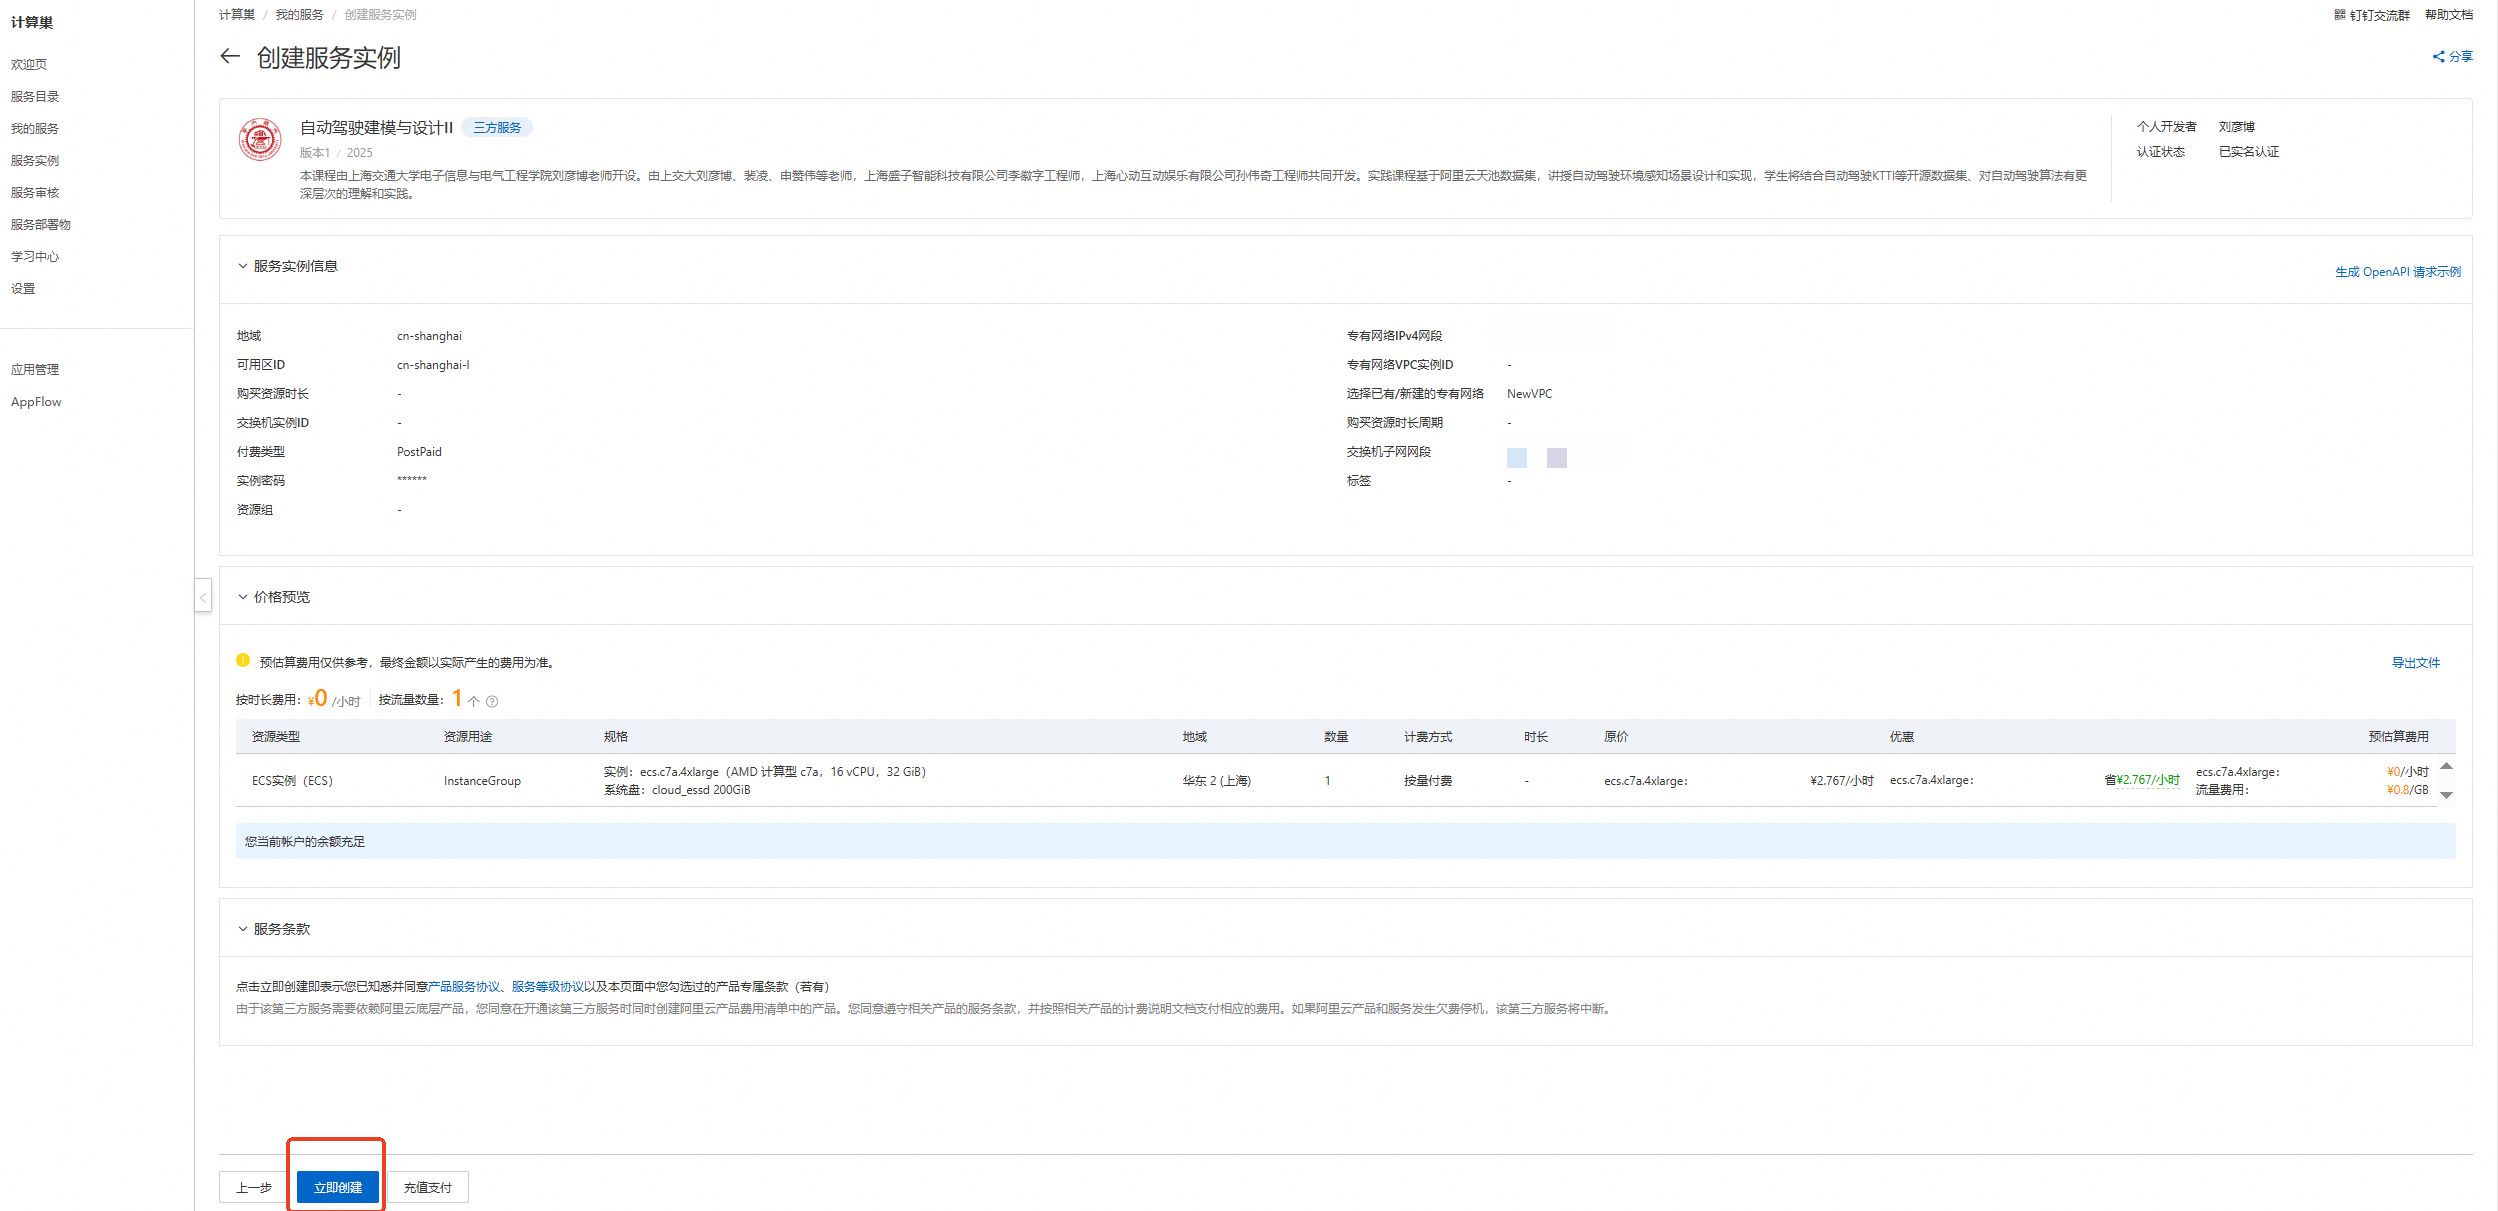
核对实例信息及价格预览,无误请点击【立即创建】
重要领取300元优惠券后,资源应为0元/小时,且会提示【您当前账户的余额充足】!若提示余额不足等,请检查是否正确领取优惠券
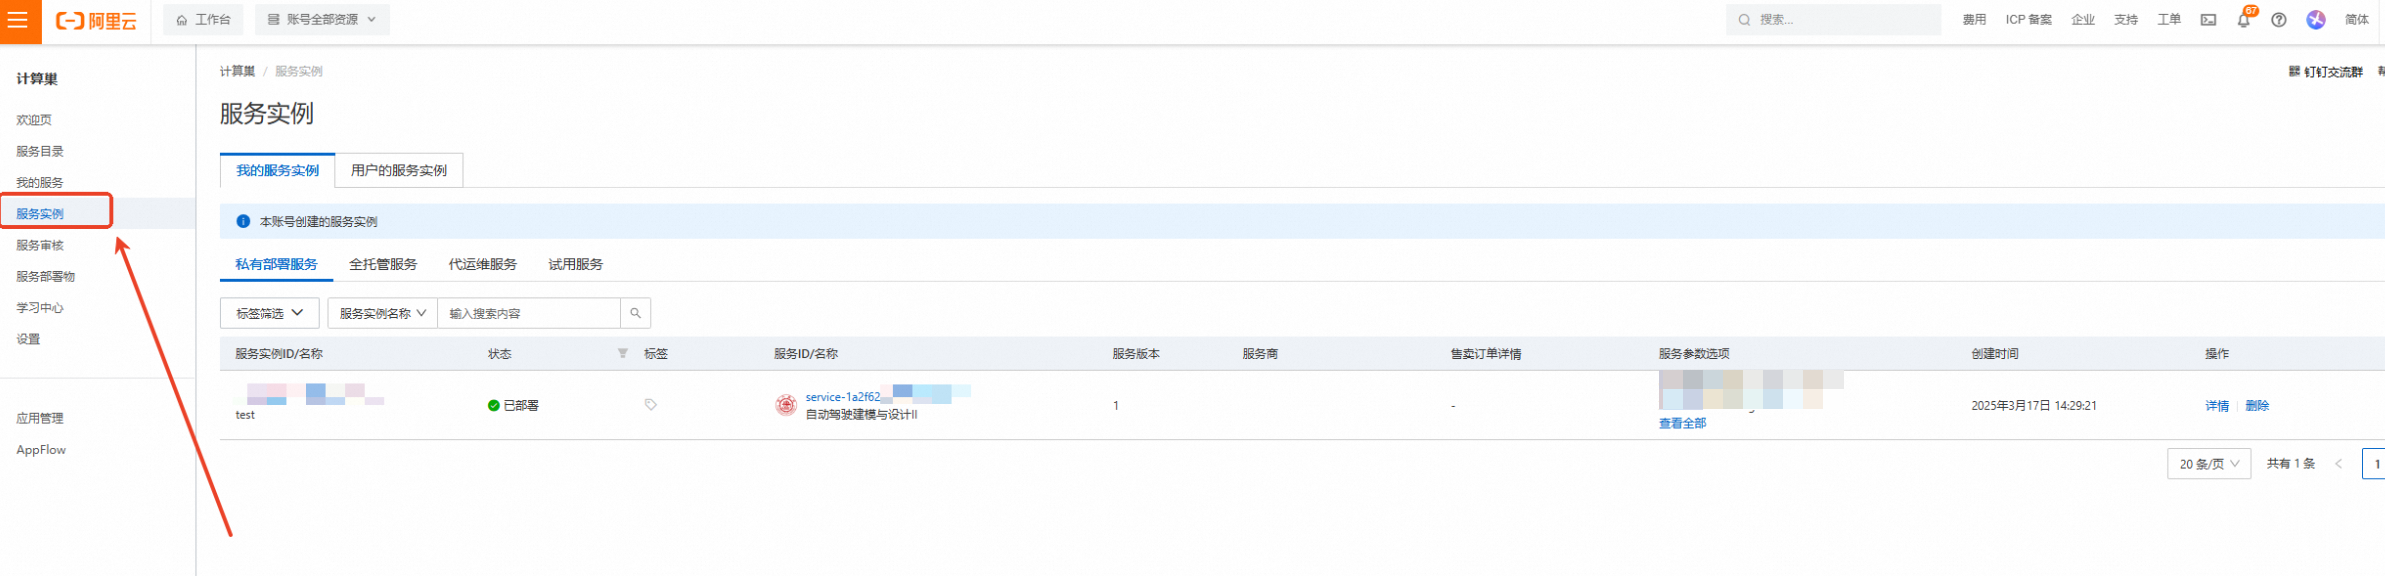
创建成功,点击【去列表查看】
查看实例,点击左侧的图标展开目录
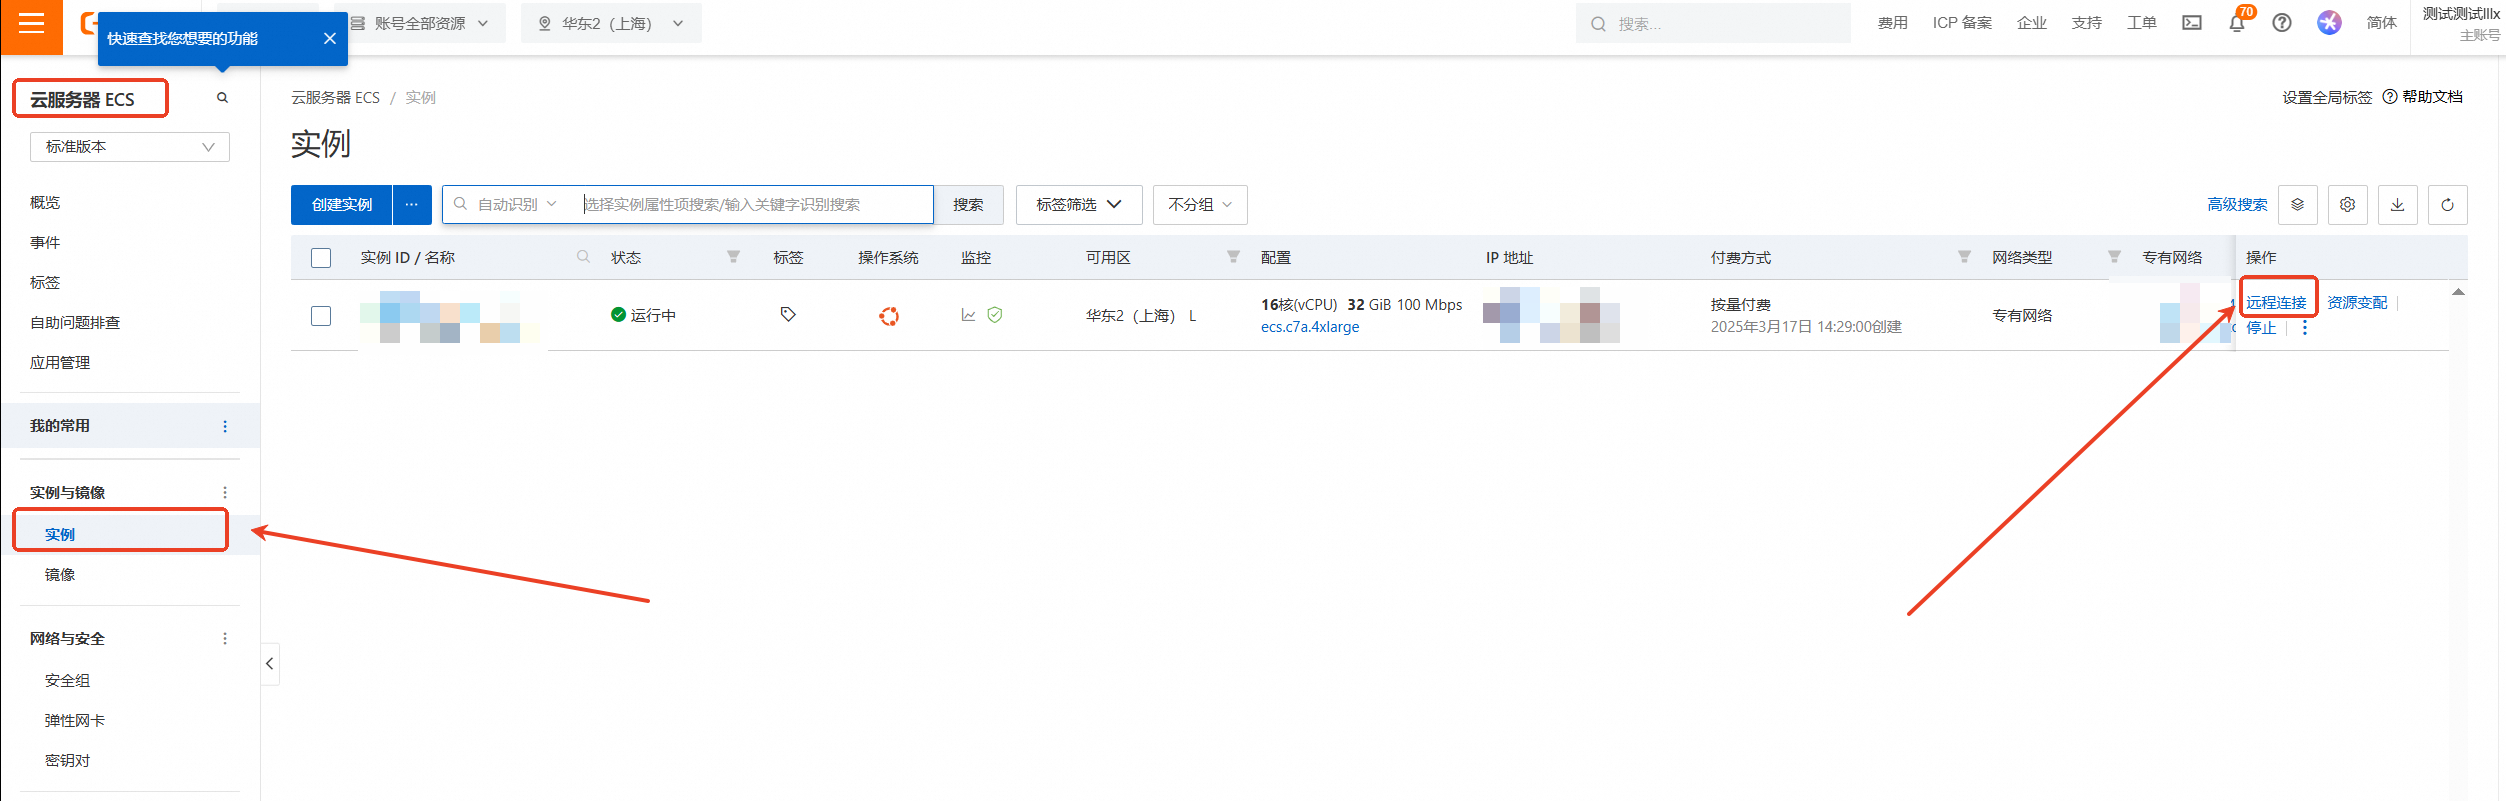
选择目录中的【云服务器ECS】
云服务器ECS—实例—远程连接
下拉展开更多登录方式,选择【通过VNC远程连接】
输入实例密码:Sjtu@520(请输入您设置的密码)后回车
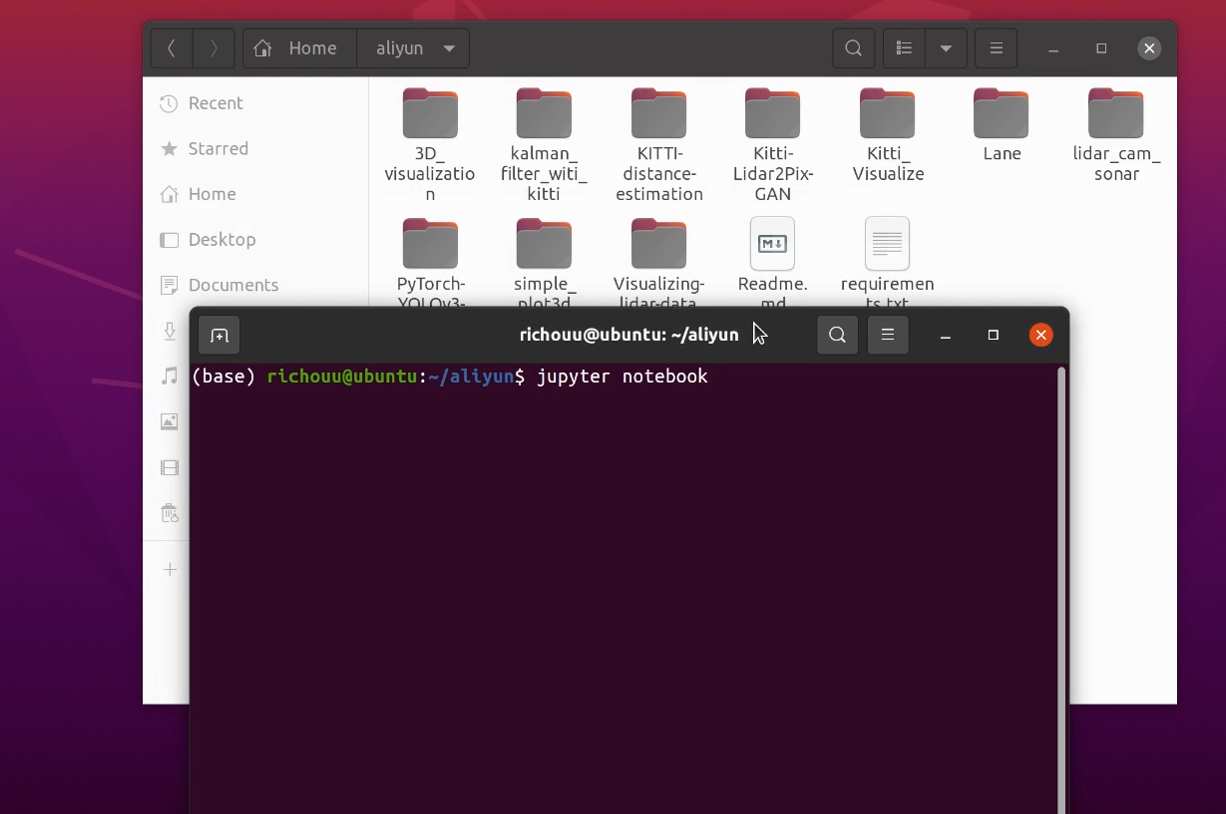
进入Ubuntu20.04系统后打开aliyun文件夹,在文件夹中右键开启终端并输入 /jupyter notebook 命令,用户名前面的(base)表示此时处于anaconda的base环境中
2、打开文件并运行
在自动弹出的浏览器页面中选择/Lane/车道线识别.ipynb并打开
点击此选项可按步运行
3、读取一张图片
使用imread函数读取图片文件,并使用imshow函数中的参数命名窗口和显示图片,图片显示后需要调用cv2.destroyAllWindows()函数进行释放。
import cv2 image = cv2.imread('/home/ecs-user/aliyun/Lane/lane.jpg')# 根据路径读取一张图片 cv2.imshow("Image",image)# 显示图片 cv2.waitKey(0)# 等待键盘触发事件,释放窗口。 cv2.destroyAllWindows()#释放窗口是个好习惯!4、读取视频
VideoCapture方法可以从本地读取视频文件,成功读取后使用imshow命名窗口并播放视频。
import cv2
cap = cv2.VideoCapture("/home/ecs-user/aliyun/Lane/lane.mp4")    #指定路径读取视频。如果cv2.VideoCapture(0),没有指定路径,则从电脑自带摄像头取视频。
ret = True
while(ret):
    ret,frame = cap.read()#按帧读取视频,它的返回值有两个:ret, frame。其中ret是布尔值,如果读取帧是正确的则返回 True,如果文件读取到结尾,它的返回值就为False。frame就是每一帧的图像,是个三维矩阵。
    if ret == True:
        cv2.imshow('Imge',frame)     #播放视频,第一个参数是视频播放窗口的名称,第二个参数是视频的当前帧。
    k = cv2.waitKey(20)    #每一帧的播放时间,毫秒级,该参数可以根据显示速率调整
    if(k & 0xff == ord('q')):  #如果中途想退出,q键退出,或播放完后,按任意键退出
        cap.release()
        cv2.destroyAllWindows()     #释放对象和销毁窗口
        break
cap.release()
cv2.waitKey(0)      # 视频结束后,按任意键退出
cv2.destroyAllWindows()
5、画一条直线
新建一个512*512*3的numpy数组作为初始图片,随后使用cv2.line函数根据起点和终点的坐标修改这个数组,并且可以自定义直线的各项参数,调用cv2.imshow函数将数组作为图片显示后可以看到成功绘制了一条直线。
import numpy as np
import cv2
img = np.zeros((512,512,3),np.uint8)  #np.zeros()有两个参数,一个是创建的图片矩阵大小,另一个是数据类型。 512,512是像素(第一个512像素高,第二个是512像素宽),3指BGR三种颜色。uint8是用0-255表示 所有颜色。
img = cv2.line(img,(0,0),(511,511),(0,0,255),5) #画直线,参数为绘图窗口,起点,终点,颜色,粗细,连通性(可选4联通或8联通,缺省是8联通) BGR
cv2.imshow('Image',img)
cv2.waitKey(0)
cv2.destroyAllWindows()
6、图像灰度处理的两种方式
对图像进行灰度处理有两种方式,第一种为修改像素点的RGB值,第二种为调用cv2.cvtColor进行处理。进行完灰度处理后显示图片。
import cv2
import numpy as np
image =cv2.imread('/home/ecs-user/aliyun/Lane/lane.jpg')
sp = image.shape
height =sp[0]
width = sp[1]
new = np.zeros((height,width,3),np.uint8)
for i in range(height):
    for j in range(width):
        new[i,j] = 0.3*image[i,j][0]+0.59*image[i,j][1]+0.11*image[i,j][2]
cv2.imshow('a_window',new)
cv2.waitKey(0)
cv2.destroyAllWindows()
import cv2 img = cv2.imread('/home/ecs-user/aliyun/Lane/lane.jpg') hls = cv2.cvtColor(img,cv2.COLOR_RGB2GRAY)#图像转换为灰度图 cv2.imshow('a_window',hls) cv2.waitKey(0) cv2.destroyAllWindows()7、图像二值化
读取图片文件,对每个像素点取最大值,随后调用图像二值化函数cv2.threshold对图像进行二值化处理,当像素值超过127时设置为255,不超过127时为0。
import cv2
import numpy as np
image =cv2.imread('/home/ecs-user/aliyun/Lane/lane.jpg')
sp = image.shape
height =sp[0]
width = sp[1]
new = np.zeros((height,width,3),np.uint8)
for i in range(height):
    for j in range(width):
        new[i,j] = max(image[i,j][0], image[i,j][1], image[i,j][2])

ret,a_new = cv2.threshold(new,127,255,cv2.THRESH_BINARY)
cv2.imshow('a_window',a_new)
cv2.waitKey(0)
cv2.destroyAllWindows()
8、高斯平滑处理
设置滤波核大小为5*5,使用cv2.GaussianBlur函数对灰度图进行高斯平滑处理,并同时显示灰度图与高斯处理后的图片。
import cv2 blur_ksize = 5 # Gaussian blur kernel size img = cv2.imread('/home/ecs-user/aliyun/Lane/lane.jpg') gray = cv2.cvtColor(img,cv2.COLOR_RGB2GRAY) blur_gray = cv2.GaussianBlur(gray, (blur_ksize, blur_ksize), 0, 0) #使用高斯模糊去噪声 cv2.imshow('a_window',gray) cv2.imshow('b_window',blur_gray) cv2.waitKey(0) cv2.destroyAllWindows()9、CANNY边缘检测
依次对图片进行灰度处理和高斯平滑处理后,使用cv2.Canny函数根据两个阈值对图片进行边缘检测。
import cv2 blur_ksize = 5 # Gaussian blur kernel size canny_lthreshold = 50 # Canny edge detection low threshold canny_hthreshold = 150 # Canny edge detection high threshold img = cv2.imread('/home/ecs-user/aliyun/Lane/lane.jpg') gray = cv2.cvtColor(img,cv2.COLOR_RGB2GRAY) blur_gray = cv2.GaussianBlur(gray, (blur_ksize, blur_ksize), 0, 0) #使用高斯模糊去噪声 edges = cv2.Canny(blur_gray, canny_lthreshold, canny_hthreshold) #使用Canny进行边缘检测 cv2.imshow('a_window',gray) cv2.imshow('b_window',blur_gray) cv2.imshow('c_window',edges) cv2.waitKey(0) cv2.destroyAllWindows()10、ROI兴趣区间
定义roi_mask函数,以实现对兴趣区域范围内图像的提取。
import numpy as np def roi_mask(img, vertices): #img是输入的图像,vertices是兴趣区的四个点的坐标(三维的数组) mask = np.zeros_like(img) #生成与输入图像相同大小的图像,并使用0填充,图像为黑色 # cv2.imshow('t_window',mask) mask_color = 255 #白色 cv2.fillPoly(mask, vertices, mask_color) #使用白色填充多边形,形成蒙板 # cv2.imshow('p_window',mask) masked_img = cv2.bitwise_and(img, mask) #img&mask,经过此操作后,兴趣区域以外的部分被蒙住了,只留下兴趣区域的图像 return masked_img roi_vtx = np.array([[(0, img.shape[0]), (460, 325), (520, 325), (img.shape[1], img.shape[0])]]) # print(img.shape) roi_edges = roi_mask(edges, roi_vtx) cv2.imshow('d_window',roi_edges) cv2.waitKey(0) cv2.destroyAllWindows()11、Hough变换
Hough变换是图像处理中,检测直线最基本,也是应用最广泛的一种传统方法。我们通过Hough变换来检测车道线。
rho = 1#rho的步长,即直线到图像原点(0,0)点的距离
theta = np.pi / 180  #theta的范围
threshold = 15  #累加器中的值高于它时才认为是一条直线
min_line_length = 40  #线的最短长度,比这个短的都被忽略
max_line_gap = 20  #两条直线之间的最大间隔,小于此值,认为是一条直线

def draw_lines(img, lines, color=[0, 0, 255], thickness=2):
    for line in lines:
        for x1, y1, x2, y2 in line:
            cv2.line(img, (x1, y1), (x2, y2), color, thickness)

def hough_lines(img, rho, theta, threshold, min_line_len, max_line_gap):
    lines = cv2.HoughLinesP(img, rho, theta, threshold, np.array([]), minLineLength=min_line_len, maxLineGap=max_line_gap)#函数输出的直接就是一组直线点的坐标位置(每条直线用两个点表示[x1,y1],[x2,y2])
    line_img = np.zeros((img.shape[0], img.shape[1], 3), dtype=np.uint8) #生成绘制直线的绘图板,黑底
    # draw_lines(line_img, lines)
    draw_lines(line_img, lines)
    return line_img

line_img = hough_lines(roi_edges, rho, theta, threshold, min_line_length, max_line_gap)
cv2.imshow('e_window',line_img)
cv2.waitKey(0)
cv2.destroyAllWindows()

def draw_lanes(img, lines, color=[255, 0, 0], thickness=8):
    left_lines, right_lines = [], []#用于存储左边和右边的直线
    for line in lines:#对直线进行分类
        for x1, y1, x2, y2 in line:
            k = (y2 - y1) / (x2 - x1)
            if k < 0:
                left_lines.append(line)
            else:
                right_lines.append(line)

    if (len(left_lines) <= 0 or len(right_lines) <= 0):
        return img

    clean_lines(left_lines, 0.1)#弹出左侧不满足斜率要求的直线
    clean_lines(right_lines, 0.1)#弹出右侧不满足斜率要求的直线
    left_points = [(x1, y1) for line in left_lines for x1,y1,x2,y2 in line]#提取左侧直线族中的所有的第一个点
    left_points = left_points + [(x2, y2) for line in left_lines for x1,y1,x2,y2 in line]#提取左侧直线族中的所有的第二个点
    right_points = [(x1, y1) for line in right_lines for x1,y1,x2,y2 in line]#提取右侧直线族中的所有的第一个点
    right_points = right_points + [(x2, y2) for line in right_lines for x1,y1,x2,y2 in line]#提取右侧直线族中的所有的第二个点

    left_vtx = calc_lane_vertices(left_points, 325, img.shape[0])#拟合点集,生成直线表达式,并计算左侧直线在图像中的两个端点的坐标
    right_vtx = calc_lane_vertices(right_points, 325, img.shape[0])#拟合点集,生成直线表达式,并计算右侧直线在图像中的两个端点的坐标

    cv2.line(img, left_vtx[0], left_vtx[1], color, thickness)#画出直线
    cv2.line(img, right_vtx[0], right_vtx[1], color, thickness)#画出直线

 #将不满足斜率要求的直线弹出
def clean_lines(lines, threshold):
    slope = [(y2 - y1) / (x2 - x1) for line in lines for x1, y1, x2, y2 in line]
    while len(lines) > 0:
        mean = np.mean(slope)   #计算斜率的平均值,因为后面会将直线和斜率值弹出
        diff = [abs(s - mean) for s in slope]#计算每条直线斜率与平均值的差值
        idx = np.argmax(diff)#计算差值的最大值的下标
        if diff[idx] > threshold:#将差值大于阈值的直线弹出
            slope.pop(idx)#弹出斜率
            lines.pop(idx)#弹出斜率
        else:
            break

#拟合点集,生成直线表达式,并计算直线在图像中的两个端点的坐标
def calc_lane_vertices(point_list, ymin, ymax):
    x = [p[0] for p in point_list]#提取x
    y = [p[1] for p in point_list]#提取y
    fit = np.polyfit(y, x, 1)#用一次多项式x=a*y+b拟合这些点,fit是(a,b)
    fit_fn = np.poly1d(fit)#生成多项式对象a*y+b

    xmin = int(fit_fn(ymin))#计算这条直线在图像中最左侧的横坐标
    xmax = int(fit_fn(ymax))#计算这条直线在图像中最右侧的横坐标

    return [(xmin, ymin), (xmax, ymax)]

def hough_lines(img, rho, theta, threshold, min_line_len, max_line_gap):
    lines = cv2.HoughLinesP(img, rho, theta, threshold, np.array([]), minLineLength=min_line_len, maxLineGap=max_line_gap)
    line_img = np.zeros((img.shape[0], img.shape[1], 3), dtype=np.uint8)
    draw_lanes(line_img, lines)
    # draw_lines(line_img, lines)
    return line_img

line_img = hough_lines(roi_edges, rho, theta, threshold, min_line_length, max_line_gap)
cv2.imshow('e_window',line_img)
cv2.waitKey(0)
cv2.destroyAllWindows()
13、完整程序,读取视频实时拟合车道线
结合上面的各个部分,读取本地视频文件进行车道线的检测,并将结果实时绘制在视频上。
from moviepy import VideoFileClip
import numpy as np
import cv2

blur_ksize = 5  # Gaussian blur kernel size
canny_lthreshold = 50  # Canny edge detection low threshold
canny_hthreshold = 150  # Canny edge detection high threshold

# Hough transform parameters
rho = 1
theta = np.pi / 180
threshold = 15
min_line_length = 40
max_line_gap = 20

def roi_mask(img, vertices):
    mask = np.zeros_like(img)

    if len(img.shape) > 2:
        channel_count = img.shape[2]  # i.e. 3 or 4 depending on your image
        mask_color = (255,) * channel_count
    else:
        mask_color = 255

    cv2.fillPoly(mask, vertices, mask_color)
    masked_img = cv2.bitwise_and(img, mask)
    return masked_img


def draw_roi(img, vertices):
    cv2.polylines(img, vertices, True, [255, 0, 0], thickness=2)


def hough_lines(img, rho, theta, threshold, min_line_len, max_line_gap):
    lines = cv2.HoughLinesP(img, rho, theta, threshold, np.array([]), minLineLength=min_line_len, maxLineGap=max_line_gap)
    line_img = np.zeros((img.shape[0], img.shape[1], 3), dtype=np.uint8)

    draw_lanes(line_img, lines)
    return line_img

def draw_lanes(img, lines, color=[0, 0, 255], thickness=8):
    left_lines, right_lines = [], []
    for line in lines:
        for x1, y1, x2, y2 in line:
            k = (y2 - y1) / (x2 - x1)
            if k < 0:
                left_lines.append(line)
            else:
                right_lines.append(line)

    if (len(left_lines) <= 0 or len(right_lines) <= 0):
        return img

    clean_lines(left_lines, 0.1)
    clean_lines(right_lines, 0.1)
    left_points = [(x1, y1) for line in left_lines for x1,y1,x2,y2 in line]
    left_points = left_points + [(x2, y2) for line in left_lines for x1,y1,x2,y2 in line]
    right_points = [(x1, y1) for line in right_lines for x1,y1,x2,y2 in line]
    right_points = right_points + [(x2, y2) for line in right_lines for x1,y1,x2,y2 in line]

    left_vtx = calc_lane_vertices(left_points, 325, img.shape[0])
    right_vtx = calc_lane_vertices(right_points, 325, img.shape[0])

    cv2.line(img, left_vtx[0], left_vtx[1], color, thickness)
    cv2.line(img, right_vtx[0], right_vtx[1], color, thickness)


def clean_lines(lines, threshold):
    slope = [(y2 - y1) / (x2 - x1) for line in lines for x1, y1, x2, y2 in line]
    while len(lines) > 0:
        mean = np.mean(slope)
        diff = [abs(s - mean) for s in slope]
        idx = np.argmax(diff)
        if diff[idx] > threshold:
            slope.pop(idx)
            lines.pop(idx)
        else:
            break


def calc_lane_vertices(point_list, ymin, ymax):
    x = [p[0] for p in point_list]
    y = [p[1] for p in point_list]
    fit = np.polyfit(y, x, 1)
    fit_fn = np.poly1d(fit)

    xmin = int(fit_fn(ymin))
    xmax = int(fit_fn(ymax))

    return [(xmin, ymin), (xmax, ymax)]

def process_an_image(img):
    roi_vtx = np.array([[(0, img.shape[0]), (460, 325), (520, 325), (img.shape[1], img.shape[0])]])

    gray = cv2.cvtColor(img, cv2.COLOR_RGB2GRAY)
    blur_gray = cv2.GaussianBlur(gray, (blur_ksize, blur_ksize), 0, 0)
    edges = cv2.Canny(blur_gray, canny_lthreshold, canny_hthreshold)
    roi_edges = roi_mask(edges, roi_vtx)
    line_img = hough_lines(roi_edges, rho, theta, threshold, min_line_length, max_line_gap)
    res_img = cv2.addWeighted(img, 0.8, line_img, 1, 0)

    return res_img

# 实时显示
cap = cv2.VideoCapture("/home/ecs-user/aliyun/Lane/lane.mp4")    #指定路径读取视频。如果cv2.VideoCapture(0),没有指定路径,则从电脑自带摄像头取视频。
ret = True

while(ret):
    ret,frame = cap.read()#按帧读取视频,它的返回值有两个:ret, frame。其中ret是布尔值,如果读取帧是正确的则返回 True,如果文件读取到结尾,它的返回值就为False。frame就是每一帧的图像,是个三维矩阵。
    if ret == True:
        cv2.imshow('Imge',frame)     #播放视频,第一个参数是视频播放窗口的名称,第二个参数是视频的当前帧。
        res_img = process_an_image(frame)
        cv2.imshow('AQ',res_img)
    k = cv2.waitKey(20)    #每一帧的播放时间,毫秒级,该参数可以根据显示速率调整
    if(k & 0xff == ord('q')):  #如果中途想退出,q键退出,或播放完后,按任意键退出
        cap.release()
        cv2.destroyAllWindows()     #释放对象和销毁窗口
        break


cv2.waitKey(0)
cv2.destroyAllWindows()


清理资源
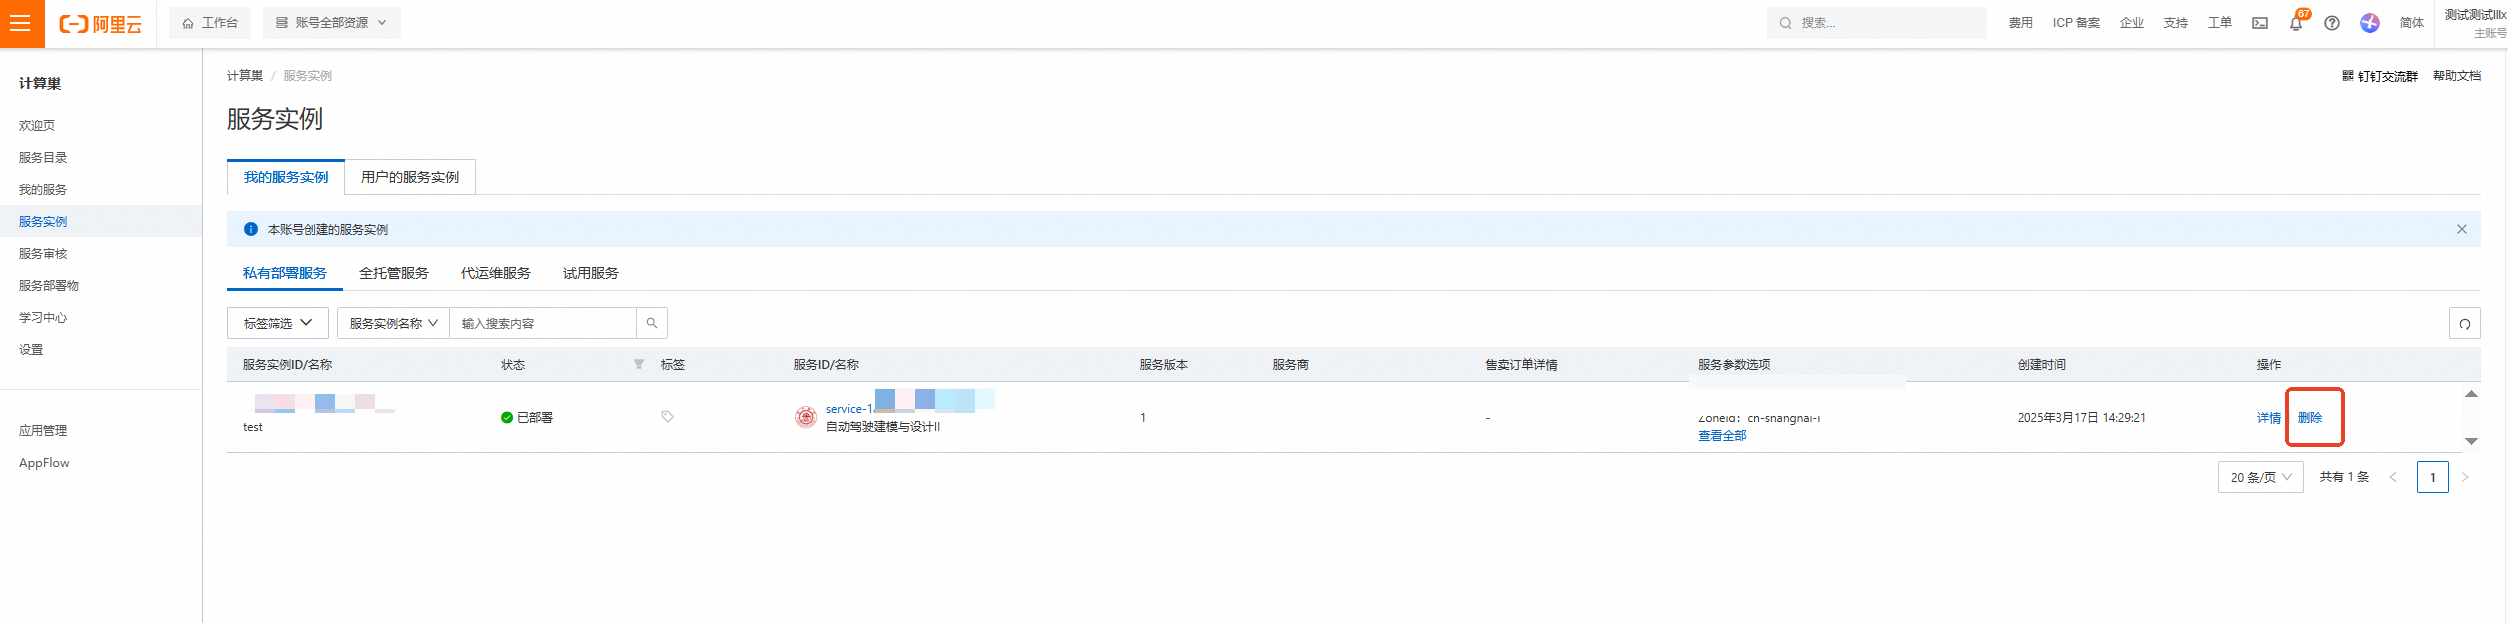
计算巢—服务实例—复制服务实例ID,点击【删除】
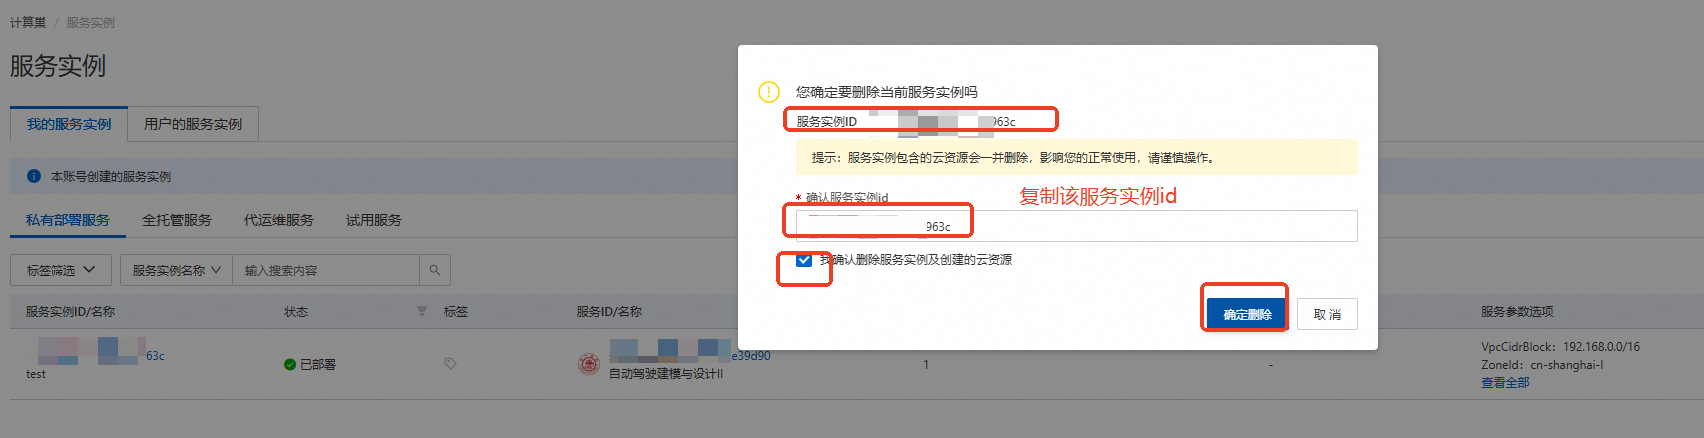
在弹窗粘贴服务实例ID,并进行勾选,点击【确定删除】
完成安全验证后,即可成功释放实例。
回到云服务器ECS——实例,检查是否成功释放资源


关闭实验
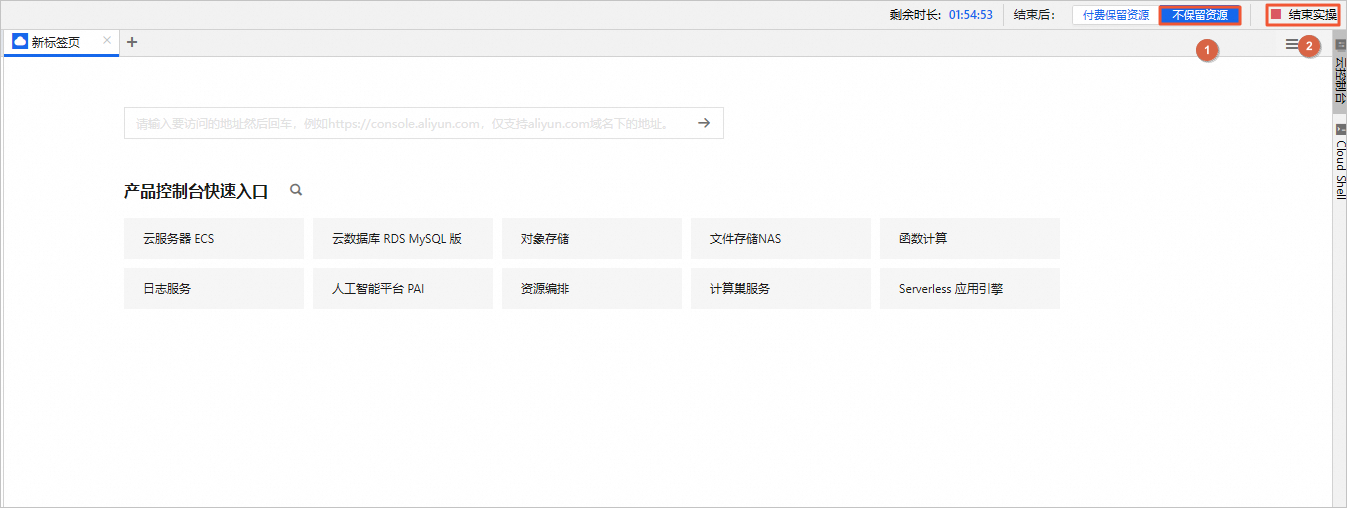
在完成实验后,如果无需继续使用资源,选择不保留资源,单击结束实操。在结束实操对话框中,单击确定。
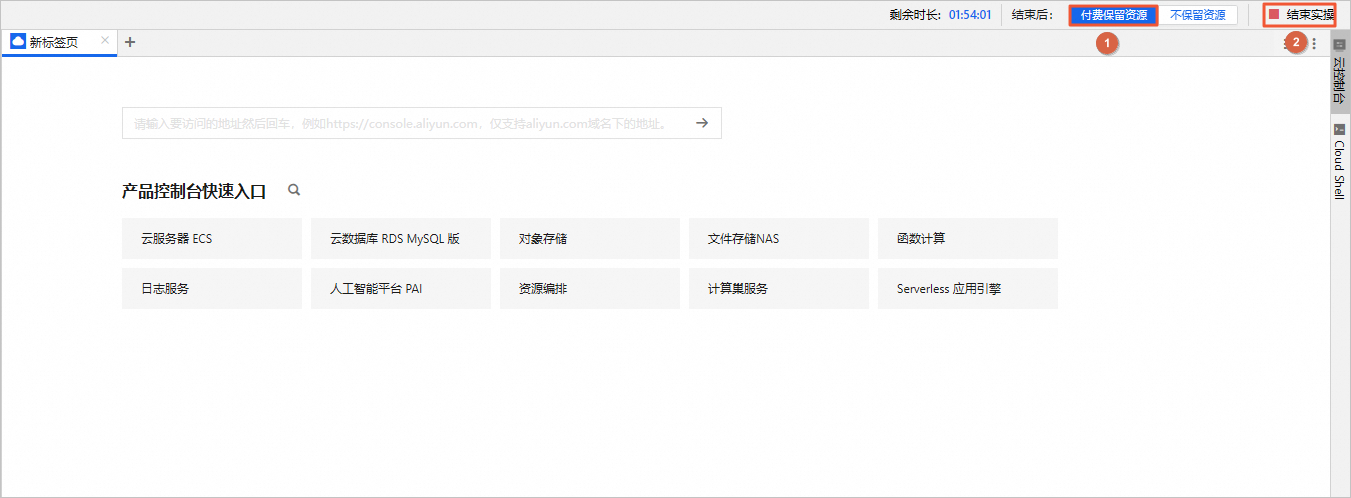
在完成实验后,如果需要继续使用资源,选择付费保留资源,单击结束实操。在结束实操对话框中,单击确定。请随时关注账户扣费情况,避免发生欠费。