本文介绍在VPC网络下的ECS实例接入可观测监控 Prometheus 版后,如何监控ECS实例。
前提条件
- 已创建ECS。
- 已将VPC网络下ECS实例接入可观测监控 Prometheus 版。具体操作,请参见Prometheus实例 for ECS
说明 本文中的参数取值均为示例,您可以根据实际情况进行修改。
操作步骤
- 下载Node Exporter。
- 通过Prometheus官网下载。
- 通过命令下载。
wget https://github.com/prometheus/node_exporter/releases/download/v1.2.0/node_exporter-1.2.0.linux-amd64.tar.gz
- 安装Node Exporter。
- 解压下载的Node Exporter。
tar -zvxf node_exporter-1.2.0.linux-amd64.tar.gz -C /usr/local/ - 重命名解压后的文件。
mv /usr/local/node_exporter-1.2.0.linux-amd64 /usr/local/node_exporter - 启动Node Exporter。
cd /usr/local/node_exporter nohup ./node_exporter & - 检查9100端口是否被占用。
ss -naltp | grep 9100返回信息如下时,表示9100端口未被占用。
LISTEN 0 4096 *:9100 *:* users:(("node_exporter",pid=1420**,fd=3))如果9100端口被占用,则执行以下命令调整启动参数中的端口。例如,端口可以调整为9999。
nohup ./node_exporter --web.listen-address=":9999"&
- 解压下载的Node Exporter。
- 检查服务。启动Node后通过命令访问以下地址。
curl http://localhost:9100/metrics说明- 请根据实际情况替换命令中的
localhost和端口。 - 建议在其他ECS实例上也进行地址访问测试(http://[ECS IP]:9100/metrics),检查连接是否通畅,避免被安全组限制。
预计可得到以下返回结果。
# HELP go_gc_duration_seconds A summary of the pause duration of garbage collection cycles. # TYPE go_gc_duration_seconds summary go_gc_duration_seconds{quantile="0"} 0 go_gc_duration_seconds{quantile="0.25"} 0 go_gc_duration_seconds{quantile="0.5"} 0 go_gc_duration_seconds{quantile="0.75"} 0 go_gc_duration_seconds{quantile="1"} 0 go_gc_duration_seconds_sum 0 go_gc_duration_seconds_count 0 # HELP go_goroutines Number of goroutines that currently exist. # TYPE go_goroutines gauge go_goroutines 7 # HELP go_info Information about the Go environment. # TYPE go_info gauge go_info{version="go1.16.6"} 1 # HELP go_memstats_alloc_bytes Number of bytes allocated and still in use. # TYPE go_memstats_alloc_bytes gauge go_memstats_alloc_bytes 1.386192e+06 # HELP go_memstats_alloc_bytes_total Total number of bytes allocated, even if freed. # TYPE go_memstats_alloc_bytes_total counter go_memstats_alloc_bytes_total 1.386192e+06 # HELP go_memstats_buck_hash_sys_bytes Number of bytes used by the profiling bucket hash table. # TYPE go_memstats_buck_hash_sys_bytes gauge go_memstats_buck_hash_sys_bytes 4562 # HELP go_memstats_frees_total Total number of frees. # TYPE go_memstats_frees_total counter go_memstats_frees_total 754 - 请根据实际情况替换命令中的
- 添加服务发现。
在左侧导航栏单击实例列表,进入可观测监控 Prometheus 版的实例列表页面。
- 单击目标Prometheus实例的名称。
- 在左侧导航栏单击服务发现,然后单击配置页签。
- 在配置页签可以通过以下两种方式添加服务发现。
方式一:修改默认服务发现
- 在默认服务发现页签,单击vpc-ecs-service-discovery右侧的详情。
- 在YAML配置对话框中修改以下内容,然后单击确认。
将默认的端口9100改为实际的端口。
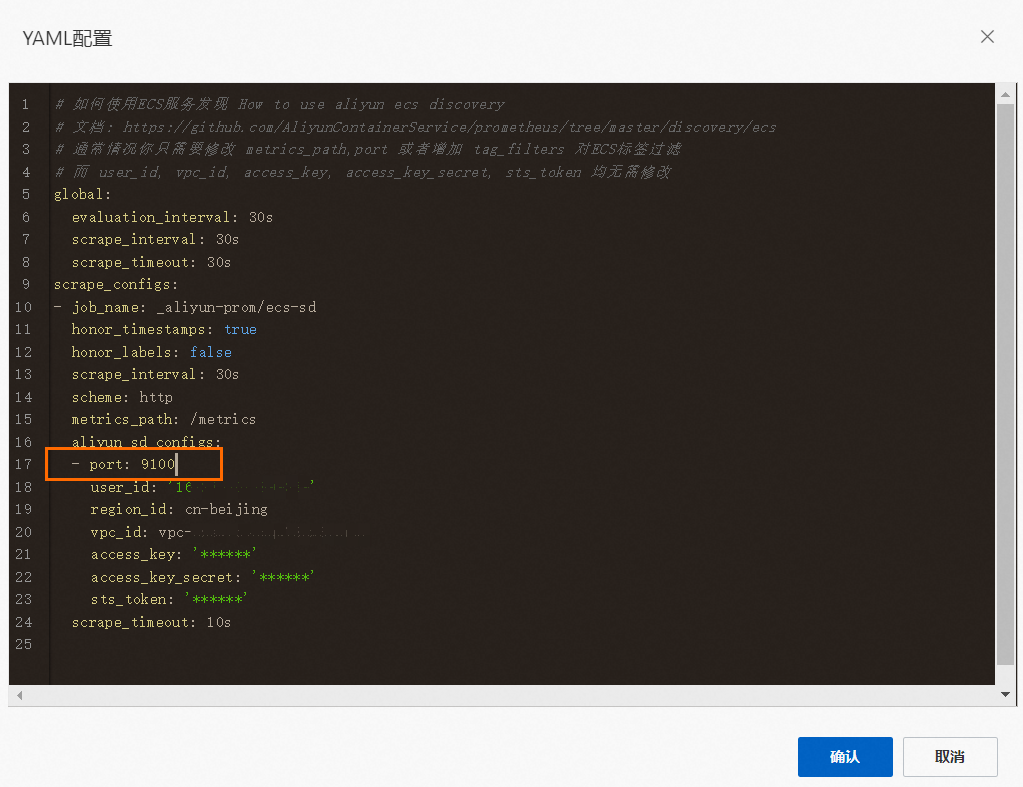
此处会采集当前VPC网络下所有ECS实例上的9100/metrics端点。
如果您只希望采集部分ECS实例,则可以通过配置tag_filters来对ECS实例按标签进行过滤。#格式如下 tag_filters: - key: 'testKey' values: ['testValue']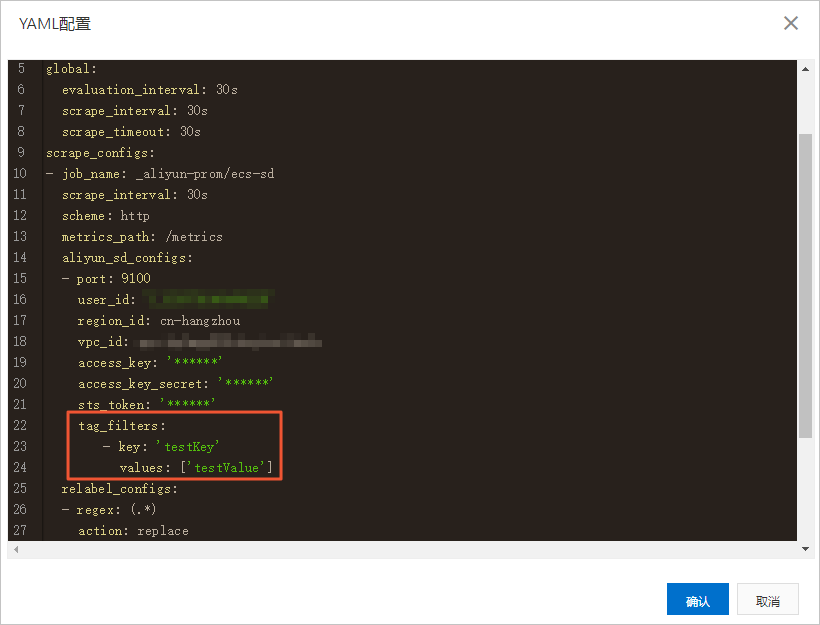
方式二:自定义服务发现
- 在自定义服务页签,单击新增。
- 在弹出的对话框,输入采集的指标参数,然后单击确定。
- 创建Grafana大盘。
- 登录本地Grafana。
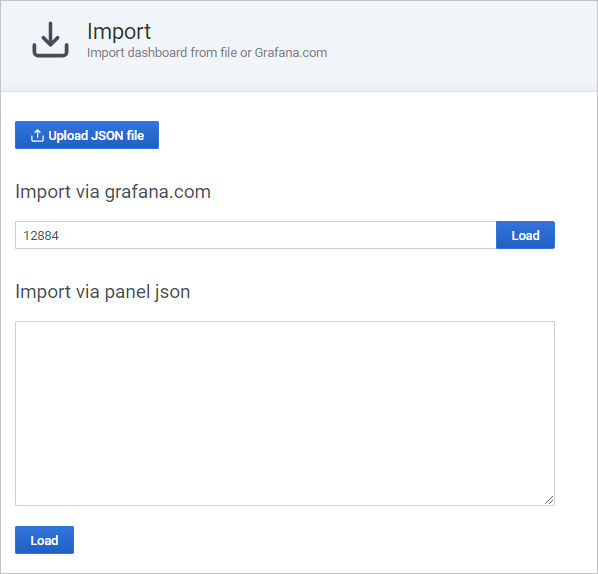
- 在左侧导航栏选择
 > + Import。
 - 在Import页面的Import via grafana.com文本框,输入Prometheus提供的Node大盘模板的ID12884,然后在其右侧单击Load。说明 如需获取其他Grafana大盘模板,请参见Dashboards。
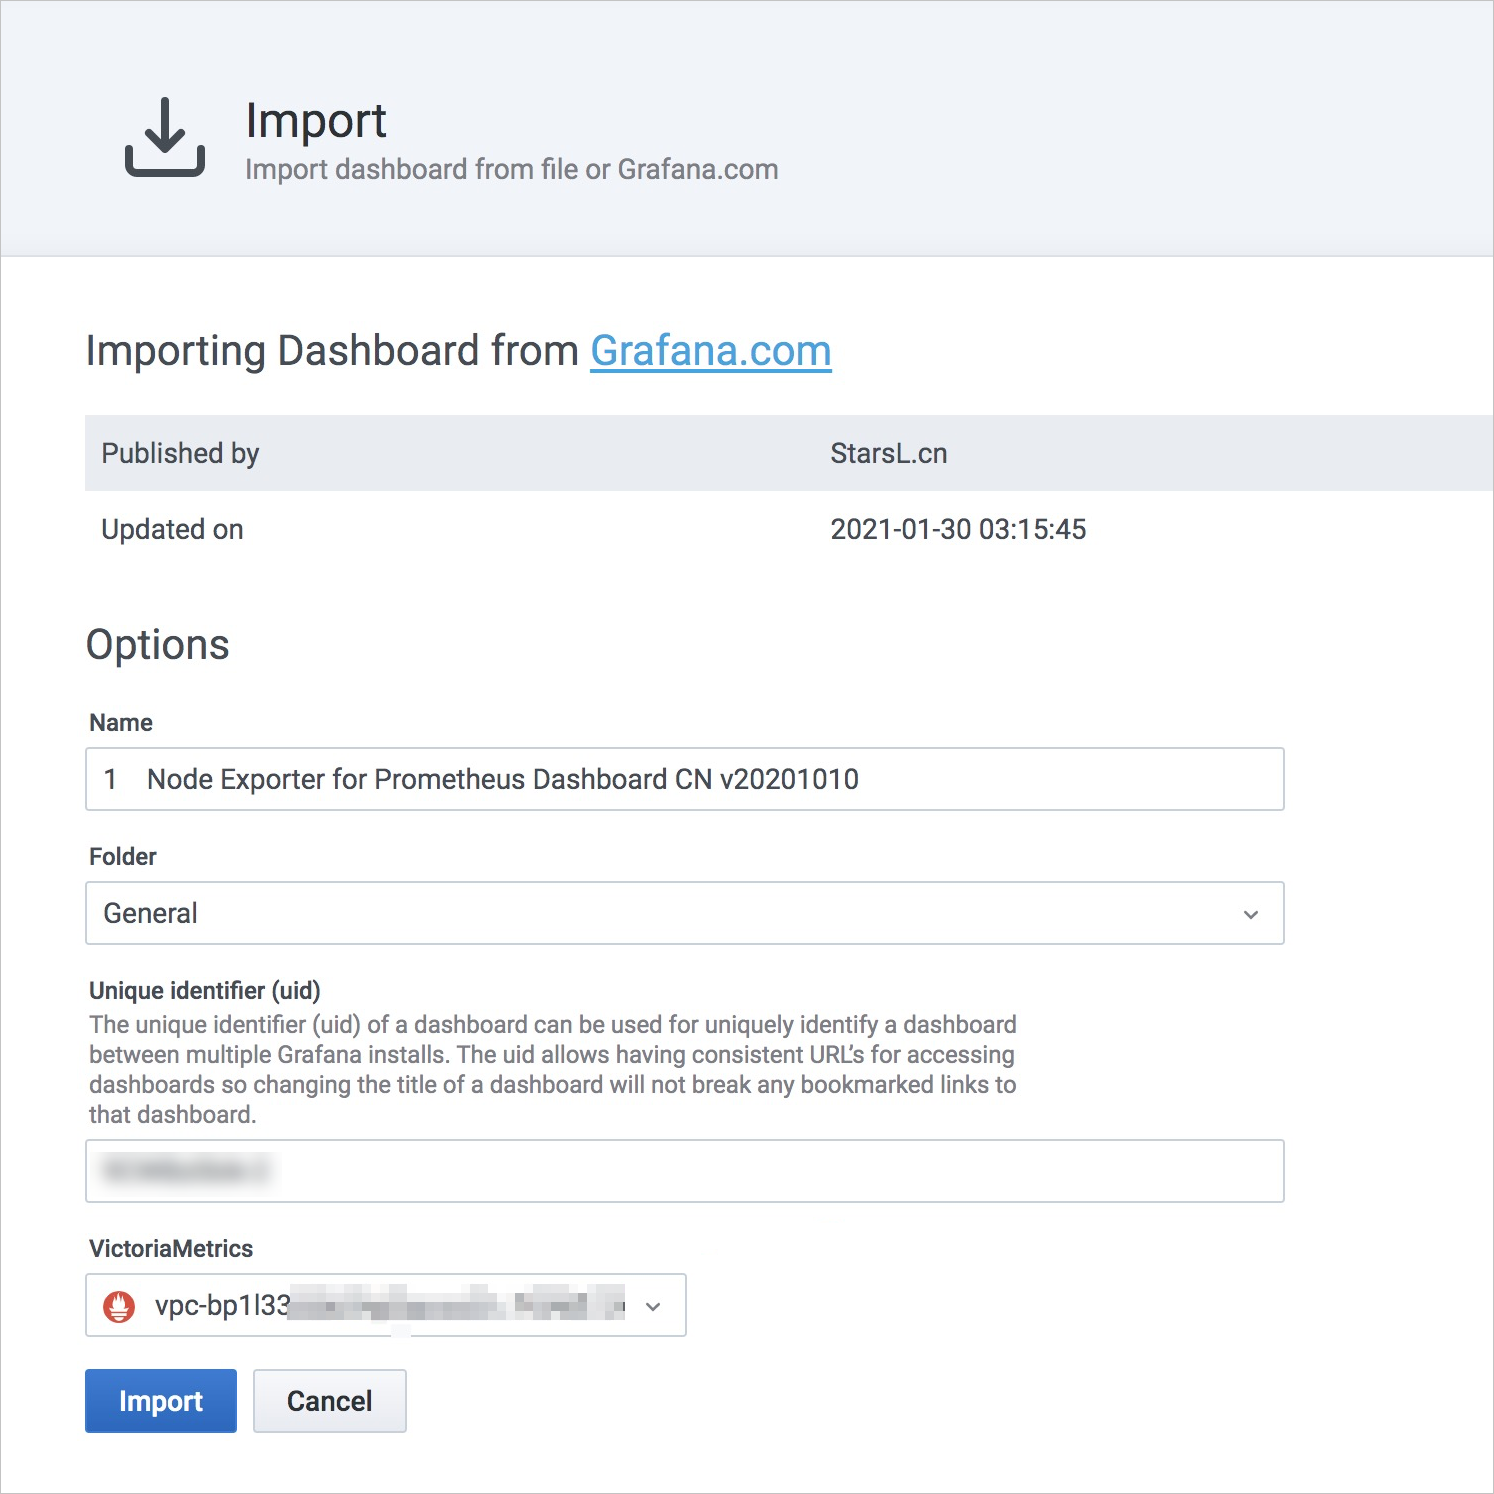
- 在Prometheus下拉列表,选择您的VPC网络下的数据源,然后单击Import。
VPC网络下的数据源名称格式为:vpc-****。
 导入成功后即可查看Grafana大盘。
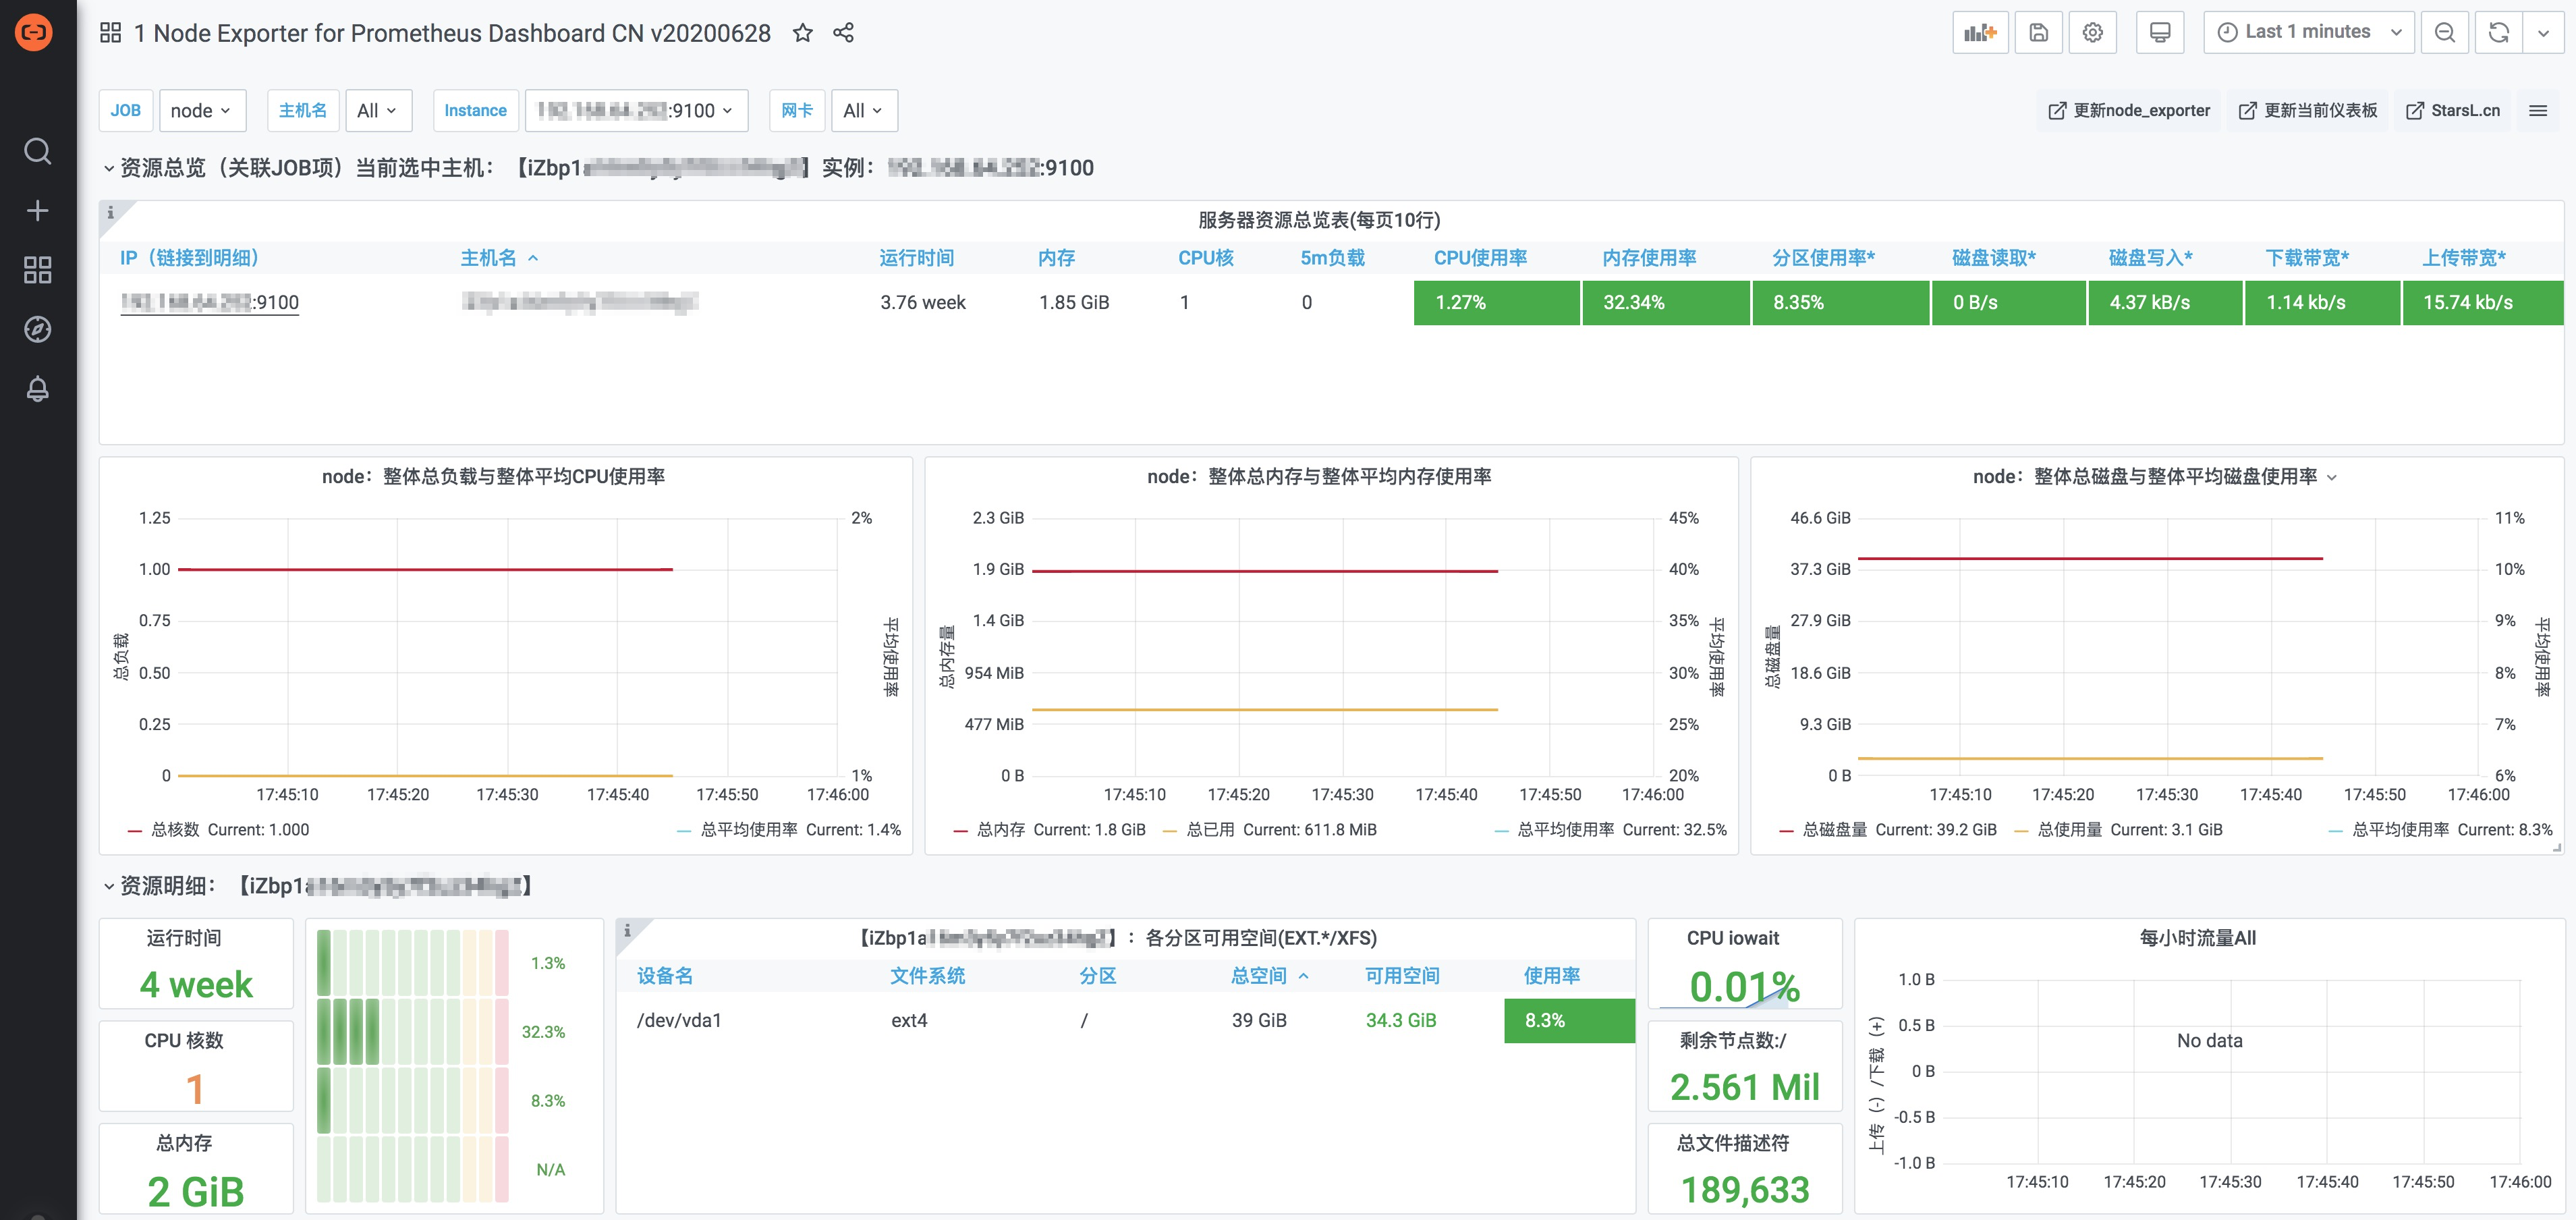
反馈
- 本页导读 (1)
文档反馈