Grafana提供丰富的可视化界面,同时具备告警功能。您可以在Grafana中,添加Contact point配置。添加完成后,Grafana会将告警消息发送到日志服务告警系统中。由日志服务告警系统完成告警降噪、通知等处理。本文适用于Grafana 8.0及以上版本。
前提条件
Grafana配置
- 创建Contact point。
- 在Create contact point页面中,配置如下参数。
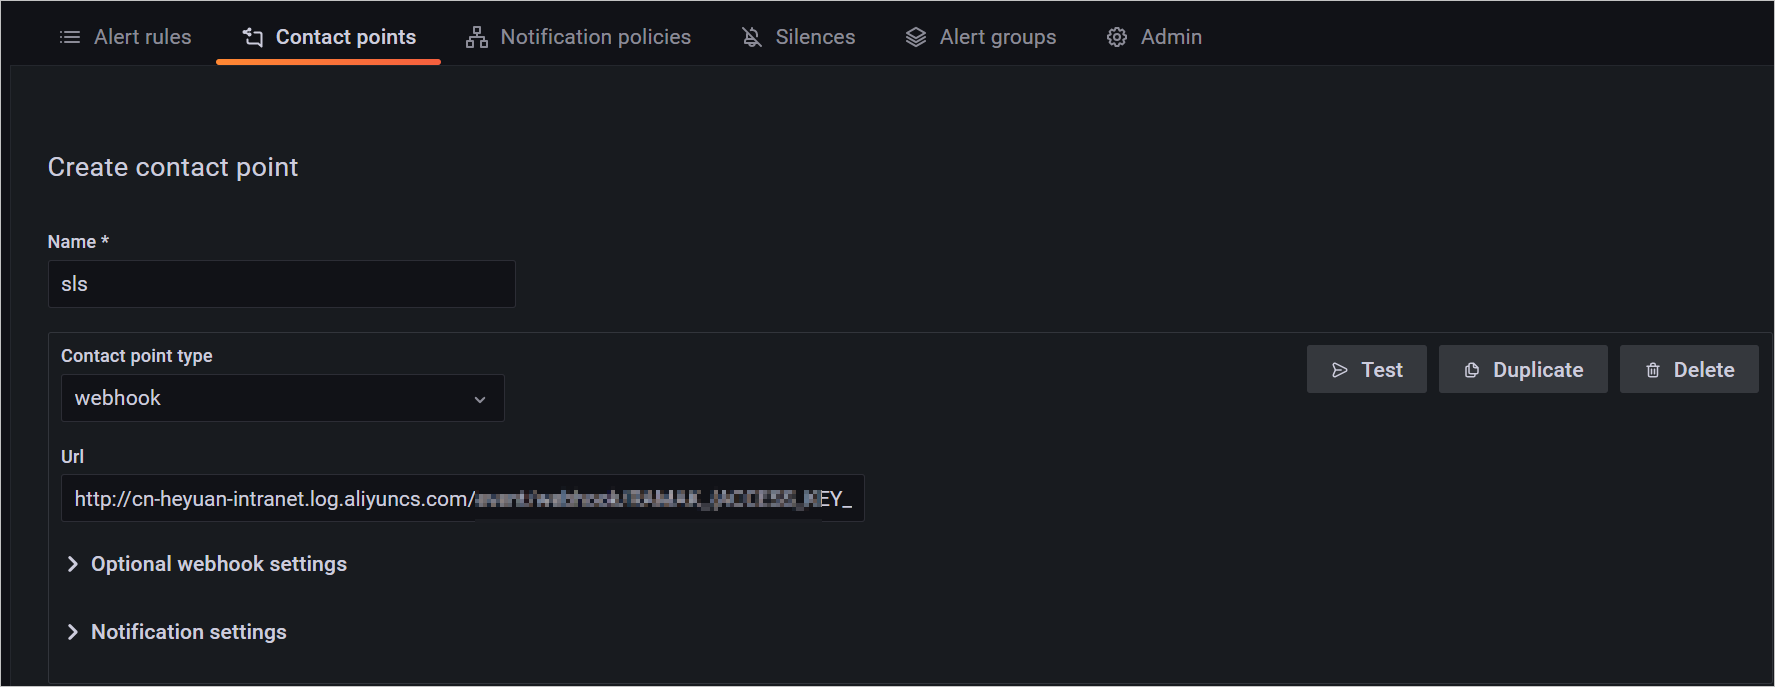
参数 说明 Name 设置Contact point名称。 Contact point type Contact point的类型,此处配置为webhook。 Url Contact point的URL,此处配置为您在日志服务中创建开放告警服务和应用后生成的接口信息(完整URL)。如何获取,请参见获取接口信息。
- 在Create contact point页面中,配置如下参数。
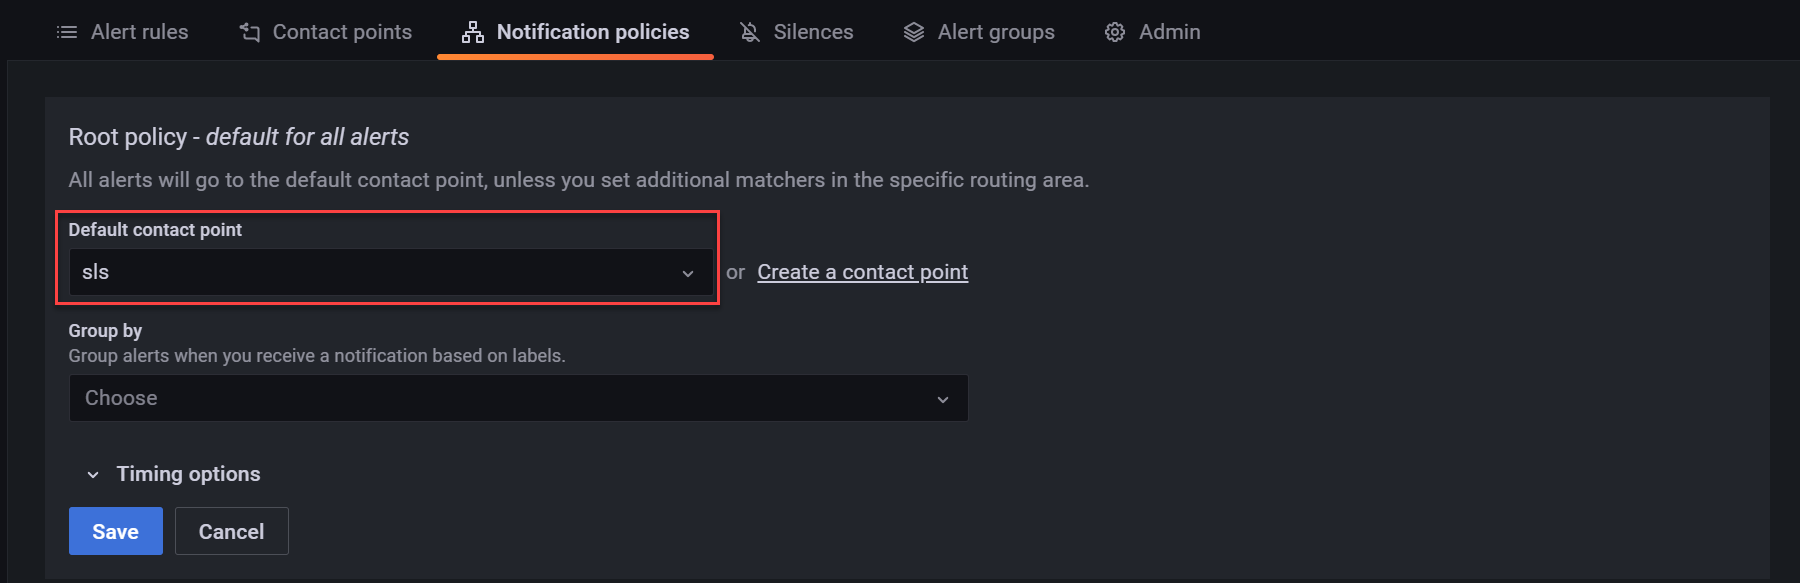
- 为通知策略绑定Contact point。您可以通过修改通知策略的根策略或新建路由策略来绑定Contact point。此处以修改根策略为例。
- 在Default contact point列表中选择您在步骤2中创建的Contact Point。
- 在Default contact point列表中选择您在步骤2中创建的Contact Point。
Grafana告警消息
Grafana告警消息内容示例如下:
{
    "receiver": "http",
    "status": "firing",
    "alerts":
    [
        {
            "status": "firing",
            "labels":
            {
                "alertname": "test"
            },
            "annotations":
            {
                "description": "test alert",
            },
            "startsAt": "2022-02-17T21:44:07.106902+08:00",
            "endsAt": "0001-01-01T00:00:00Z",
            "generatorURL": "http://localhost:3000/alerting/abcd/edit",
            "fingerprint": "65d7bbdb01ce6c93",
            "silenceURL": "http://localhost:3000/alerting/silence/new?alertmanager=grafana&matchers=alertname%3Dtest",
            "dashboardURL": "",
            "panelURL": "",
            "valueString": "[ metric='go_threads{instance=\"prometheus\", job=\"prometheus\"}' labels={__name__=go_threads, instance=prometheus, job=prometheus} value=15 ]"
        }
    ],
    "groupLabels":
    {},
    "commonLabels":
    {
        "alertname": "test"
    },
    "commonAnnotations":
    {
        "description": "test alert",
    },
    "externalURL": "http://localhost:3000/",
    "version": "1",
    "groupKey": "{}/{alertname=\"test\"}:{}",
    "truncatedAlerts": 0,
    "orgId": 1,
    "title": "[FIRING:1]  (test)",
    "state": "alerting",
    "message": "**Firing**\n\nValue: [ metric='go_threads{instance=\"prometheus\", job=\"prometheus\"}' labels={__name__=go_threads, instance=prometheus, job=prometheus} value=15 ]\nLabels:\n - alertname = test\nAnnotations:\n - description = test alert\nSource: http://localhost:3000/alerting/abcd/edit\nSilence: http://localhost:3000/alerting/silence/new?alertmanager=grafana&matchers=alertname%3Dtest\n"
}
字段映射
Grafana告警消息被接入到日志服务后,映射为日志服务告警内容。示例如下:
{
    "aliuid": "{开放告警应用所属的阿里云账号ID}",
    "alert_instance_id": "{自动生成}",
    "alert_id": "test",
    "alert_type": "sls_pub",
    "alert_name": "test",
    "region": "{告警中心Project所在的地域}",
    "project": "{告警中心所属的Project}",
    "project_id": 0,
    "next_eval_interval": 0,
    "alert_time": 1645607565,
    "fire_time": 1645105447,
    "fire_results": null,
    "fire_results_count": 0,
    "resolve_time": 0,
    "status": "firing",
    "results": null,
    "labels":
    {},
    "annotations":
    {
        "__config_app__": "sls_pub_alert",
        "__pub_alert_app__": "{开放告警应用ID}",
        "__pub_alert_protocol__": "grafana8",
        "__pub_alert_region__": "{接收告警消息的网络接口对应的地域}",
        "__pub_alert_service__": "{开放告警服务ID}",
        "desc": "test alert",
        "fingerprint": "65d7bbdb01ce6c93",
        "silenceURL": "http://localhost:3000/alerting/silence/new?alertmanager=grafana&matchers=alertname%3Dtest",
        "valueString": "[ metric='go_threads{instance=\"prometheus\", job=\"prometheus\"}' labels={__name__=go_threads, instance=prometheus, job=prometheus} value=15 ]"
    },
    "severity": 6,
    "policy":
    {
        "alert_policy_id": "{开放告警应用中配置的告警策略ID}",
        "action_policy_id": "{开放告警应用中配置的行动策略ID}",
        "use_default": false,
        "repeat_interval": "{开放告警应用中配置的重复等待时间}"
    },
    "template": null,
    "drill_down_query": "http://localhost:3000/alerting/abcd/edit",
}| 日志服务 | Grafana | 说明 |
|---|---|---|
| aliuid | 无 | 用于接入Grafana告警的开放告警应用所属的阿里云账号ID。 |
| alert_id | alertname | 告警监控规则ID。
如果Grafana告警消息的labels字段中有alertname字段,则alert_id的值为alertname字段的值,否则为空。 |
| alert_type | 无 | 告警类型,固定为sls_pub。 |
| alert_name | alertname | 告警监控规则名称。
如果Grafana告警消息的labels字段中有alertname字段,则alert_name的值为alertname字段的值,并删除原始字段。否则为空。 |
| status | status | 告警状态。 |
| next_eval_interval | 无 | 告警评估时间间隔,固定为0。 |
| alert_time | 无 | 告警首次触发时间,为日志服务接收到Grafana告警消息的时间。 |
| fire_time | startsAt | 告警触发时间。 |
| resolve_time | endsAt | 告警恢复时间。
如果Grafana告警消息中的status为firing,则resolve_time的值为0,否则为endsAt对应的时间戳。 |
| labels | labels | 告警标签信息。
如果您在创建开放告警应用时 ,在信息加工中添加了标签信息,则此标签信息将被添加到labels字段中。 |
| annotations | annotations | 告警标注信息。日志服务告警的annotations字段中将添加如下额外字段。
如果您在创建开放告警应用时 ,在信息加工中添加了标注信息,则此标注信息将被添加到annotations字段中。 |
| severity | severity | 告警严重度。
说明 如果Grafana告警消息中的annotations字段或labels字段中包含severity字段,则将Grafana告警消息发送到日志服务后,日志服务会根据该字段映射告警严重度。如果没有,则默认映射为中等。更多信息,请参见告警严重程度。
|
| policy | 无 | 您在开放告警应用中配置的告警策略。更多信息,请参见Policy结构。 |
| project | 无 | 告警中心所属的Project。更多信息,请参见项目(Project)。 |
| drill_down_query |
|
Grafana告警消息的URL。
单击该URL将跳转至Grafana告警管理页面,并自动为您显示符合groupLabels字段内容的告警消息。 |