The rise of large language models (LLMs) has increased demand for fine-grained performance monitoring and tuning of AI training and inference workloads. Many GPU-based workloads require online performance analysis of GPU containers. AI Profiling is a non-intrusive performance analysis tool built on eBPF and dynamic process injection. It is designed natively for Kubernetes container environments and supports online monitoring of container processes running GPU workloads. It collects data across multiple dimensions and enables you to start or stop data collection dynamically on live GPU workloads. For production services, a profiling tool that can attach and detach dynamically enables real-time, detailed analysis without modifying application code. This topic explains how to trigger AI Profiling from the console and view the results.
Procedure
AI Profiling in the console uses a whitelist mechanism. Existing user UIDs are automatically added to the whitelist. New users must submit a ticket to join the whitelist before using AI Profiling.
Step 1: Start diagnosis
Log on to the ACK console. In the left navigation pane, click Clusters.
On the Clusters page, click the name of your cluster. In the left navigation pane, click .
-
On the Fault and Performance Diagnosis page, click AI Profiling to open the AI Profiling page.
-
Click Diagnose to open the AI Profiling Configuration page. Complete the configuration as prompted. The available check items are listed in the table below.
Collection item
Description
Supported environment
Example chart
gpu
GPU kernel information
-
CUDA version: 12.0 to 12.8
torch
Inject Torch Profiler to collect Torch-related information
-
Torch version: >= 2.1.0
-
Python version: 3.9 to 3.12
pystack
Python method call information
-
Python version: 3.9 to 3.12
snapshot
GPU memory allocation, fragmentation, and allocation stacks
-
Torch version: >= 2.1.0
-
Python version: 3.9 to 3.12
rdma
RDMA monitoring information
-
An RDMA network interface controller (NIC) must be present

dcgm
DCGM monitoring information
nvtx
Custom NVTX markers
-
Torch version: >= 2.1.0
-
NVTX markers are added in your code
-
Python version: 3.9 to 3.12
N/A
flops
FLOPs information in Torch
-
Torch version: >= 2.1.0
-
Python version: 3.9 to 3.12
N/A
shapes
FLOPs information in Torch
-
Torch version: >= 2.1.0
-
Python version: 3.9 to 3.12
N/A
net
TCP send and receive network packet information
-
Kernel version >= 5.10
N/A
-
-
After you configure the parameters for Profiling configuration according to the table below, click Start Diagnosis.
Configuration item
Description
Example value
Profiling Configuration
Check items
Select one or more check items. See the descriptions in step 4 above.
gpu, torch, pystack, snapshot, rdma, dcgm, nvtx, flops, shapes, net
Duration
Keep the duration under 30 seconds. AI Profiling collects data in real time. Long durations may increase memory and disk usage.
5
Step 2: View results
-
Wait until the Status column shows Success. Then click Diagnostic Details to view the information.
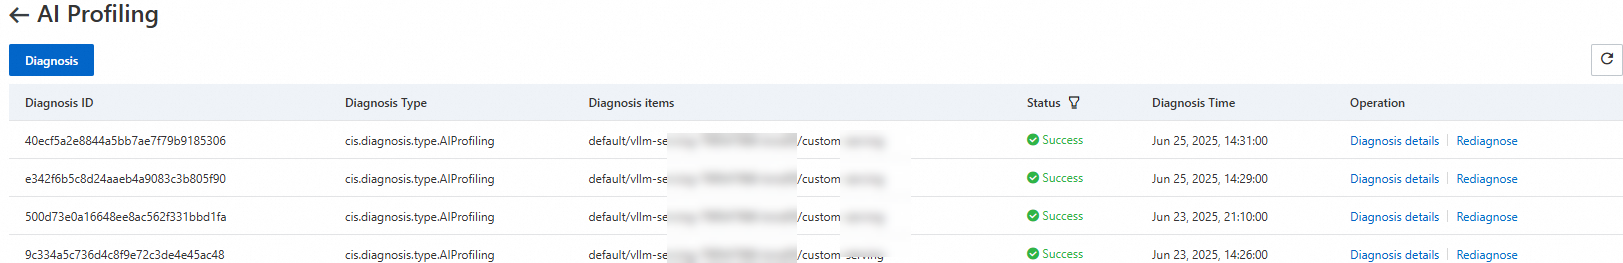
-
AI Profiling uses SysOM by default to analyze collected data and display charts. Click Diagnostic Results, then click View Charts to open the SysOM console and view the analysis results.

You will see the following views:
-
Multi-process aggregation and analysis
-
Data analysis overview
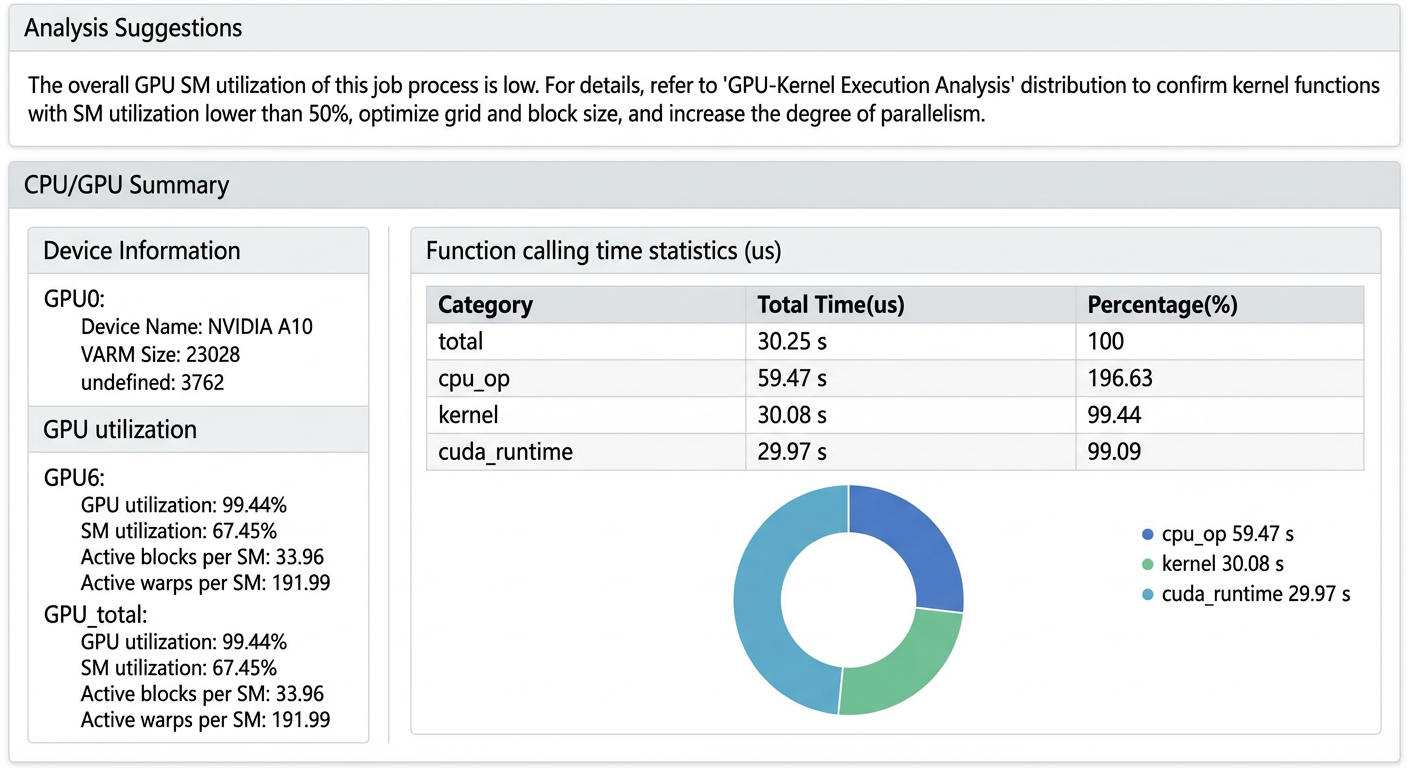
-
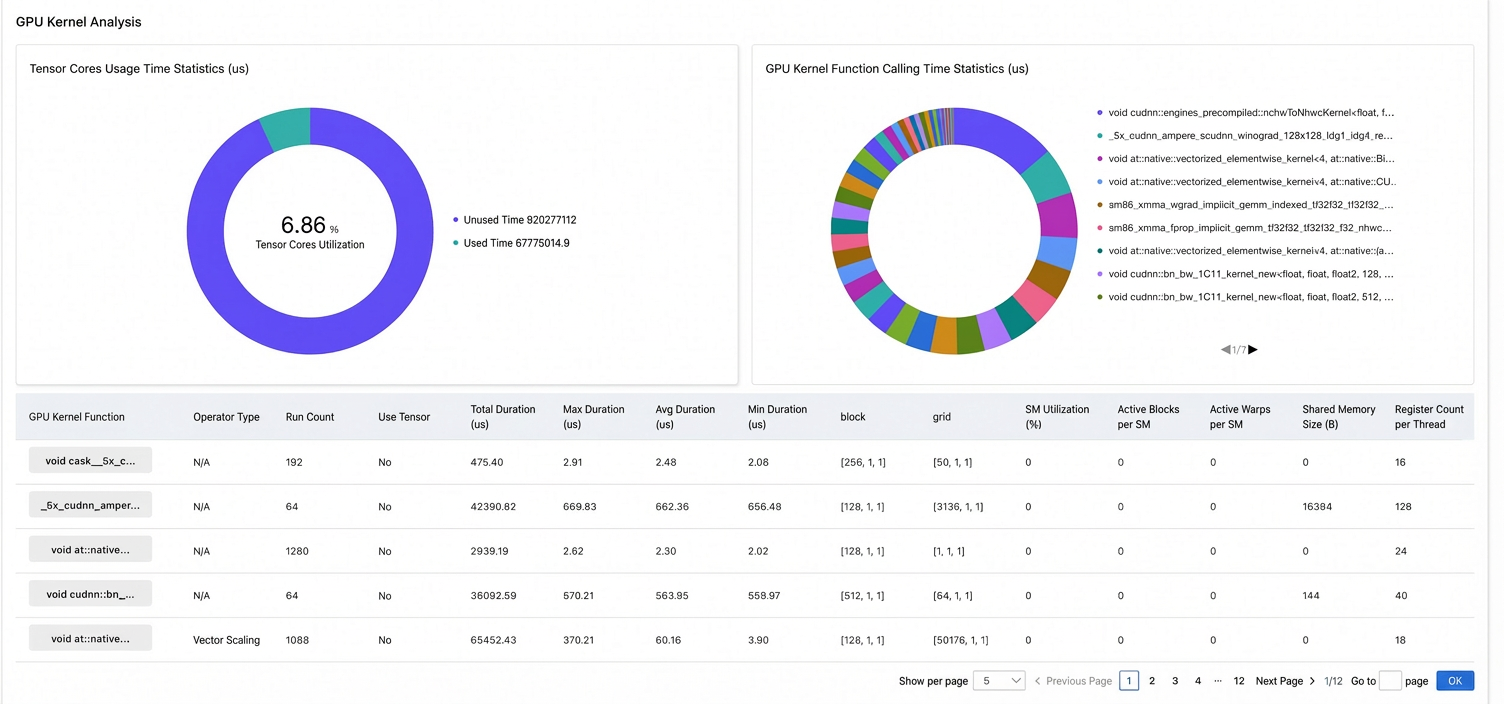
Detailed analysis of GPU CUDA kernel functions

-
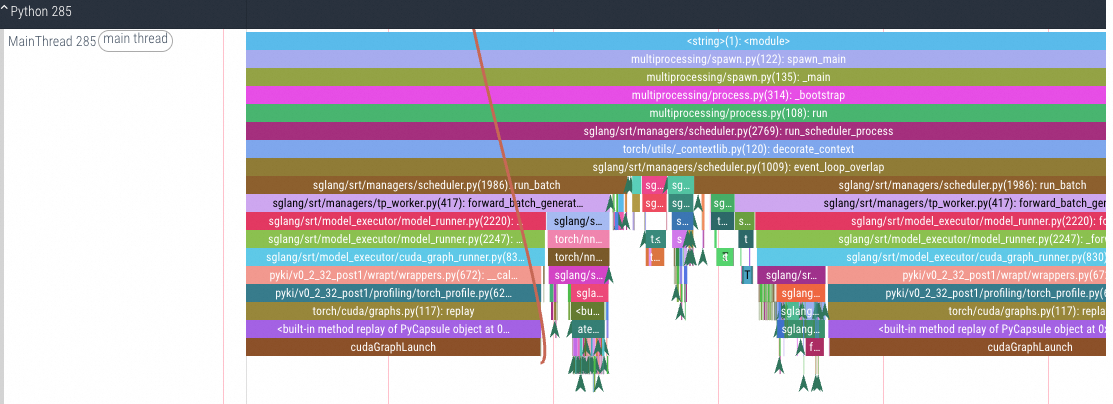
CPU/GPU tracing analysis
-
Step 3: Analyze results
For help analyzing results, see AI Profiling performance analysis examples.