Install KubeRay in ACK
This topic guides you through deploying the KubeRay Operator add-on on ACK Managed Cluster Pro, integrating Simple Log Service (SLS) and Prometheus for log collection and metrics monitoring to improve observability and high availability, and managing Ray clusters and applications with Kubernetes custom resources (CRs).
Prerequisites
Ensure the following:
-
An ACK Managed Cluster Pro running Kubernetes v1.24 or later with at least one node of 8 vCPUs and 32 GB of memory. For GPU workloads, use GPU-accelerated instance types.
Create a cluster or upgrade an existing one if needed.
Install KubeRay Operator
KubeRay Operator is in invitational preview. To get access, submit a ticket.
-
Log on to the ACK console. In the left-side navigation pane, click Clusters.
-
Click the name of your cluster.
-
On the cluster details page, choose Operations > Add-ons > Manage Applications.
-
Find and install Kuberay-Operator.
Verify: After installation, confirm the operator pod is running:
kubectl get pods -A | grep kuberayThe operator pod should show Running status. If it stays in Pending, run kubectl describe pod <pod-name> to check for scheduling errors such as insufficient node resources.
Enable log collection for KubeRay Operator
Collect control-plane logs from the KubeRay Operator itself.
-
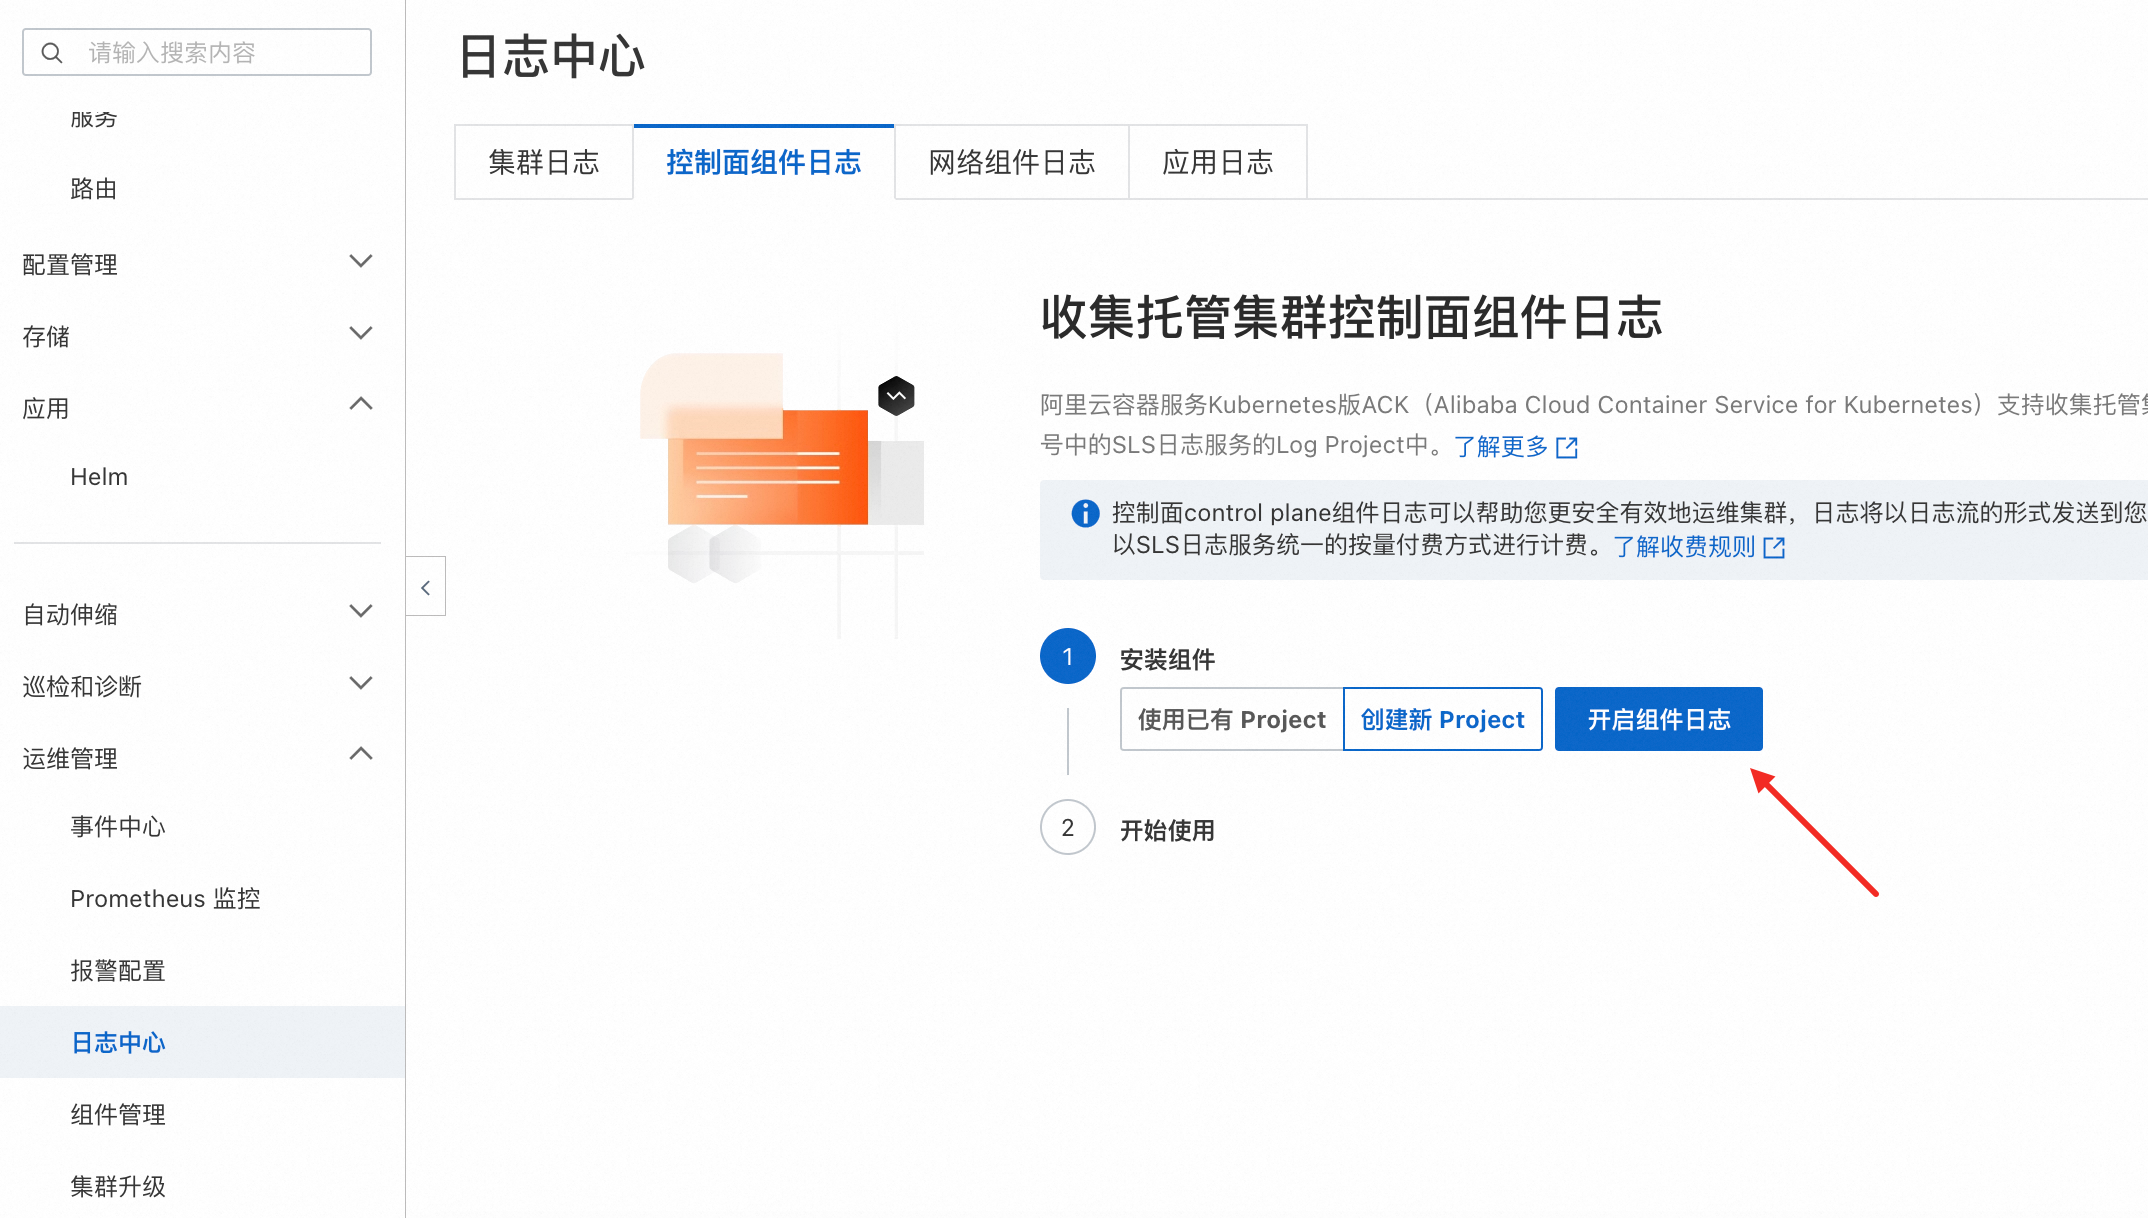
On the cluster details page, choose Operations > Log Center > Control Plane Component Logs.
-
Click Enable Component Log Collection.
-
Select kuberay-operator.
Enable log collection for Ray clusters
Forward Ray pod logs to SLS via an AliyunLogConfig custom resource. Logtail watches the Ray log directory on each pod and tags entries by cluster name and node type.
SLS is a paid service. See Billing overview for pricing.
-
Apply this manifest to create an
AliyunLogConfigobject inkube-system:Key parameters:
Parameter Description logPathLog directory on each Ray pod. Matches all sessions under /tmp/ray/. Customize if your cluster uses a different path.advanced.k8s.ExternalK8sLabelTagAdds _raycluster_name_and_node_type_tags to each log entry for filtering in SLS.All
AliyunLogConfigparameters are documented in Use CRDs to collect container logs in DaemonSet mode. -
View logs in the ACK console:
-
Log on to the ACK console. In the left-side navigation pane, click Clusters.
-
Click the name of your cluster.
-
Choose Cluster Information > Basic Information > Cluster Resources.
-
Click the Log Service Project link to open the SLS project.
-
-
Select the
rayclustersLogstore. Filter by_raycluster_name_to isolate logs from a specific Ray cluster.The following example shows the GCS debug logs of two Ray clusters. The logs of different clusters are distinguished by the
raycluster_namelabel:1 02-23 16:37:54 __tag__:__user_defined_id__: k8s-group-c96xxx c4a541c67bd __tag__:__cluster_id__: c96fe15xxx 4a541c67bd __tag__:__container_ip__: 192.xxx.0.63 __tag__:__container_name__: ray-head __tag__:__image_name__: docker.io/rayproject/ray:2.7.0 __tag__:__namespace__: raycluster __tag__:__node_ip__: 192.xxx.xxx.58 __tag__:__node_name__: cn-hangzhou.192.xxx.xxx.58 __tag__:__pod_name__: myfirst-ray-cluster-head-wpnld __tag__:__pod_uid__: 6235fabd-xxx-xxx-15b699 __tag__:_raycluster_name_: myfirst-ray-cluster content: NodeInfoGcsService.grpc_server.RegisterNode - 1 total (0 active), CPU time: mean = 94.638 us, total = 94.638 us 2 02-23 16:37:52 __tag__:__user_defined_id__: k8s-group-c96xxx c4a541c67bd __tag__:__cluster_id__: c96fe15bca1fxxx c4a541c67bd __tag__:__container_ip__: 192.xxx.0.74 __tag__:__container_name__: ray-head __tag__:__image_name__: docker.io/rayproject/ray:2.7.0 __tag__:__namespace__: default __tag__:__node_ip__: 192.xxx.xxx.58 __tag__:__node_name__: cn-hangzhou.192.xxx.xxx.58 __tag__:__pod_name__: mysecond-ray-cluster-head-hfg77 __tag__:__pod_uid__: xxx-xxx-xxx-df672 __tag__: raycluster_name: mysecond-ray-cluster content: GcsHealthCheckManager::AddNode - 1 total (0 active), CPU time: mean = 8.978 us, total = 8.978 us
Enable monitoring for Ray clusters
Collect Prometheus metrics from Ray pods with a PodMonitor for workers and a ServiceMonitor for the head node. Workers need a PodMonitor because they are standalone pods; the head node exposes metrics through a stable Service endpoint.
Managed Service for Prometheus is a paid service. See Managed Service for Prometheus instance billing for pricing. For setup, see Connect to and configure Managed Service for Prometheus.
-
Create a PodMonitor to collect metrics from Ray worker pods:
apiVersion: monitoring.coreos.com/v1 kind: PodMonitor metadata: annotations: arms.prometheus.io/discovery: 'true' arms.prometheus.io/resource: arms name: ray-workers-monitor namespace: arms-prom labels: # `release: $HELM_RELEASE`: Prometheus can only detect PodMonitor with this label. release: prometheus #ray.io/cluster: raycluster-kuberay # $RAY_CLUSTER_NAME: "kubectl get rayclusters.ray.io" spec: namespaceSelector: any: true jobLabel: ray-workers # Only select Kubernetes Pods with "matchLabels". selector: matchLabels: ray.io/node-type: worker # A list of endpoints allowed as part of this PodMonitor. podMetricsEndpoints: - port: metrics relabelings: - action: replace regex: (.+) replacement: $1 separator: ; sourceLabels: - __meta_kubernetes_pod_label_ray_io_cluster targetLabel: ray_io_cluster -
Create a ServiceMonitor to collect metrics from the Ray head node:
apiVersion: monitoring.coreos.com/v1 kind: ServiceMonitor metadata: annotations: arms.prometheus.io/discovery: 'true' arms.prometheus.io/resource: arms name: ray-head-monitor namespace: arms-prom labels: # `release: $HELM_RELEASE`: Prometheus can only detect ServiceMonitor with this label. release: prometheus spec: namespaceSelector: any: true jobLabel: ray-head # Only select Kubernetes Services with "matchLabels". selector: matchLabels: ray.io/node-type: head # A list of endpoints allowed as part of this ServiceMonitor. endpoints: - port: metrics path: /metrics targetLabels: - ray.io/cluster -
View dashboards in Application Real-Time Monitoring Service (ARMS):
-
Log on to the ARMS console. In the left-side navigation pane, click Integration Center.
-
Search for Ray and select it.
-
In the Ray panel, select your cluster and click OK.
-
In the left-side navigation pane, click Integration Management, then click the target environment name.
-
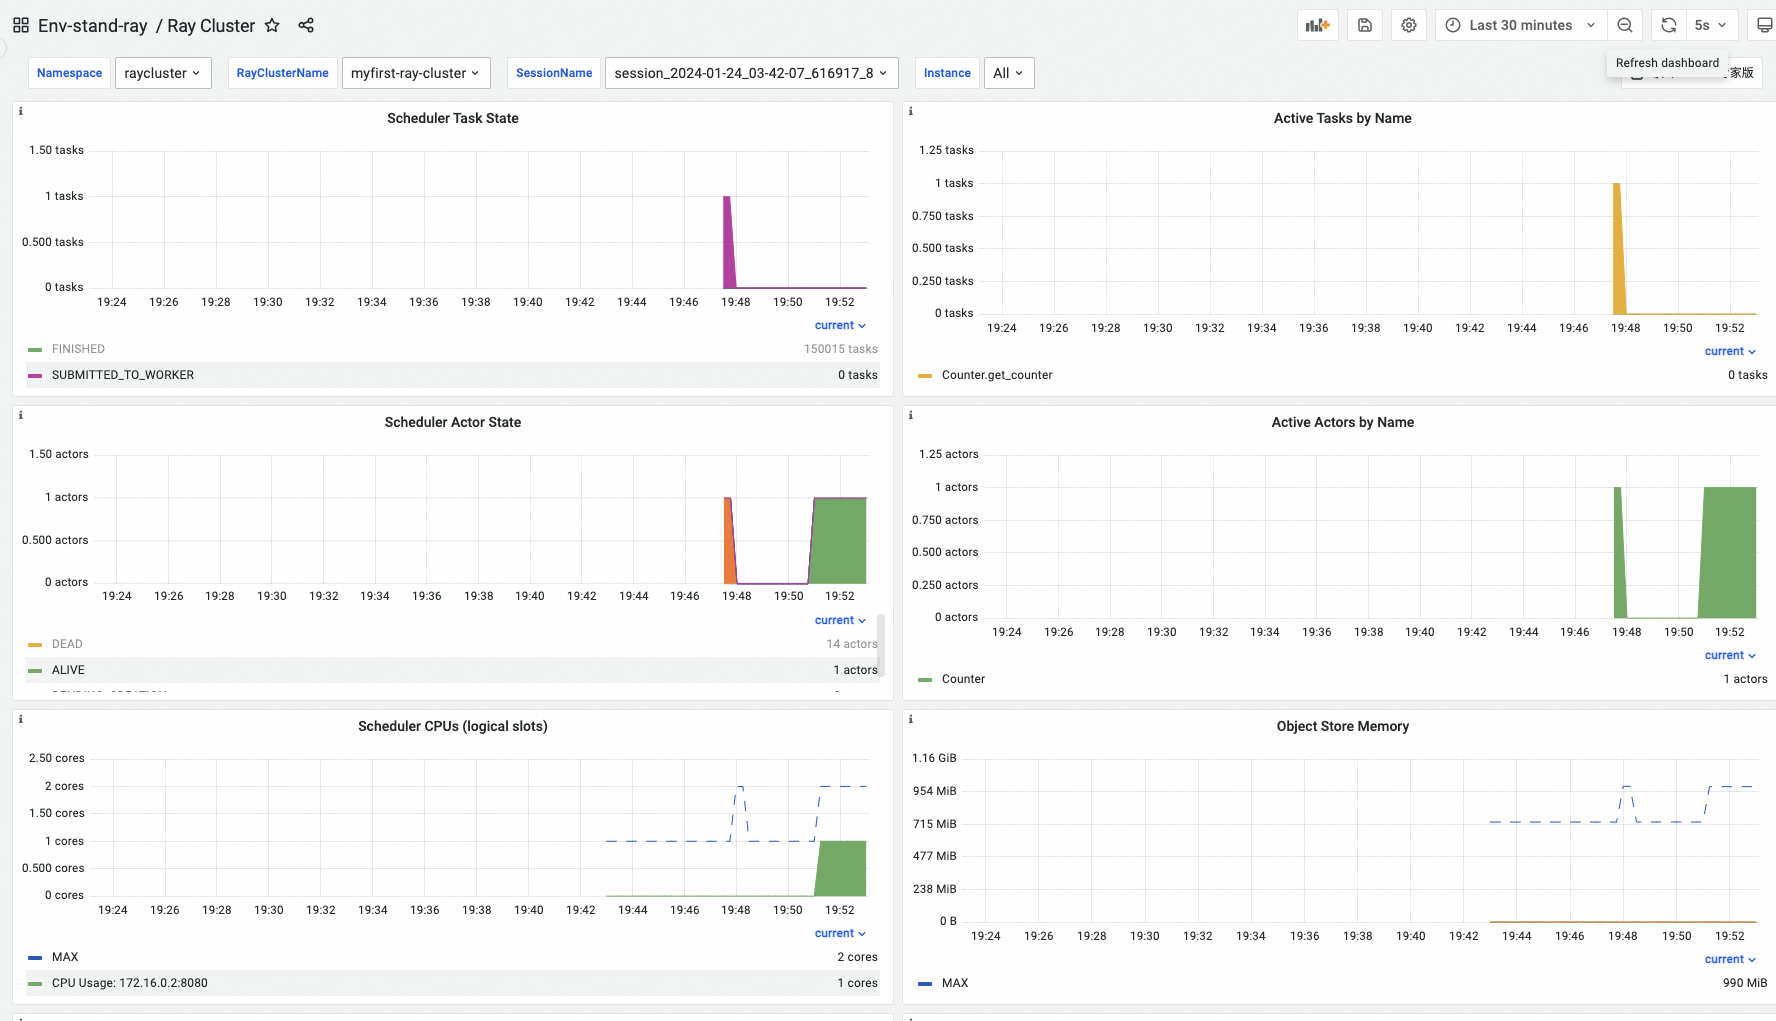
On the Component Management tab, find Dashboards under Addon Type, then click Ray Cluster.
-
Set Namespace, RayClusterName, and SessionName to filter monitoring data for a specific task.
-
Verify: In the ARMS console, both ray-workers-monitor and ray-head-monitor should appear as active scrape targets. If a target is missing, verify the release: prometheus label and that the namespace selector matches your Ray cluster namespace.
Next steps
-
Deploy a RayCluster custom resource to run distributed Ray workloads.
-
Use the
_raycluster_name_tag in SLS to correlate logs across Ray clusters. -
Set up ARMS alerting rules based on Ray cluster metrics from Prometheus.