SQL distribution statistics
更新时间:
复制 MD 格式
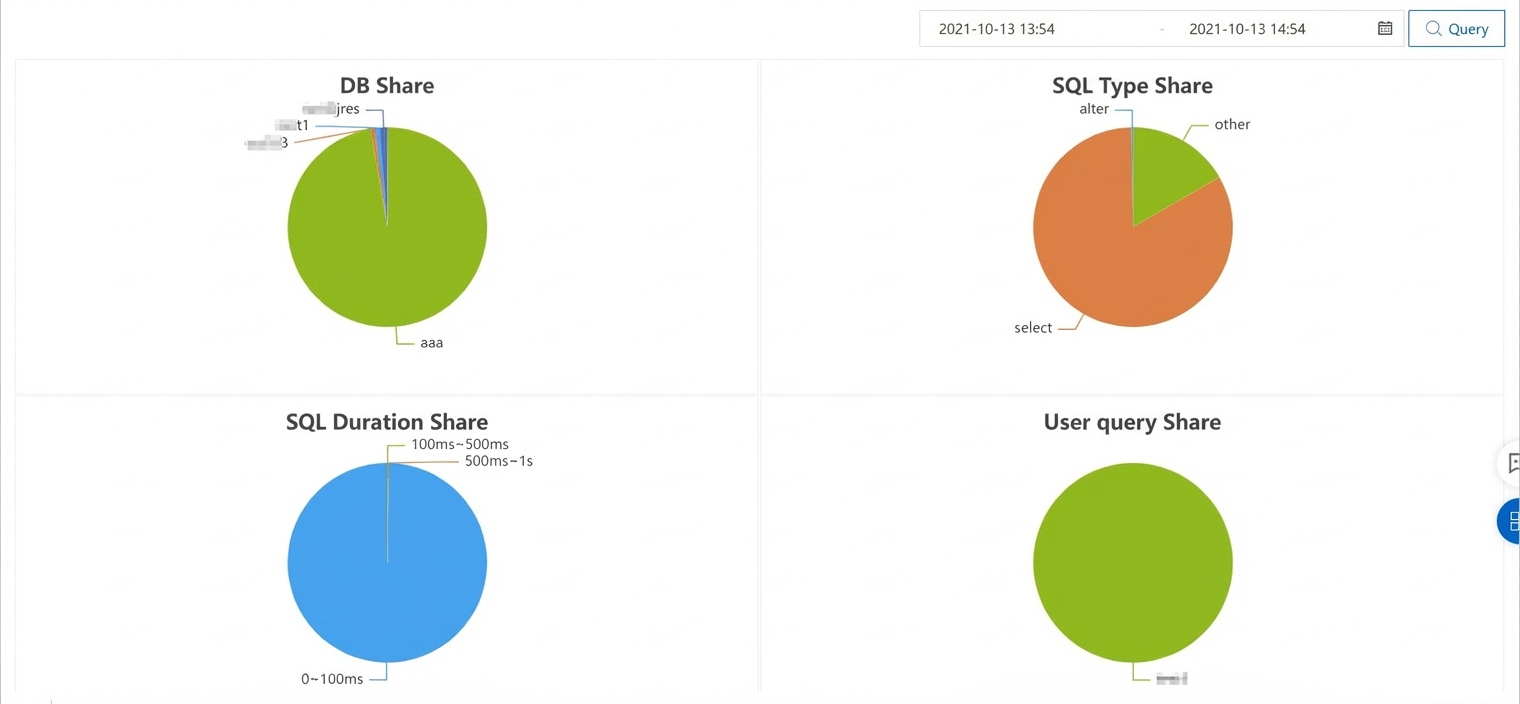
The AnalyticDB for PostgreSQL console displays the distribution of SQL queries for a specific time range, categorized by database, SQL type, execution duration, and user.
Procedure
- Log on to the AnalyticDB for PostgreSQL console.
- In the upper-left corner of the console, select a region.
- Find the instance that you want to manage and click the instance ID.
- In the left-side navigation pane, choose .
- On the SQL Distribution Statistics page, select a time range in the upper-right corner and click Search.
AnalyticDB for PostgreSQL displays the SQL distribution across four dimensions: Proportion of SQL Queries by Database, Proportion of SQL Queries by SQL Type, Proportion of SQL Queries by Execution Duration, and Proportion of SQL Queries by User.
该文章对您有帮助吗?