Control Center basic usage
Control Center is the core management and visual monitoring platform for ApsaraMQ for Confluent, where you can monitor cluster health, manage topics and schemas, and configure alerts.
Log on to Control Center
Log on to the ApsaraMQ for Confluent console. In the navigation pane on the left, click Instances.
-
In the top navigation bar, select a region. On the Instances page, click the name of your target instance.
-
In the upper-right corner of the Instance Details page, click Log on to Console to open Control Center.
NoteLog on to Control Center with the root username and password that you configured when you deployed the instance.
-
After logging on, you are redirected to the Home page in Control Center.
The page shows cluster health through Healthy clusters and Unhealthy clusters badges and cluster cards. Each card displays the cluster name, running status, overview metrics (Brokers, Partitions, Topics, Production, Consumption), and the number of connected ksqlDB clusters and Connect clusters.
Create a topic
-
Log on to Control Center. On the Home page, click the controlcenter.clusterk card to go to the Cluster overview page.
The left-side navigation menu includes Cluster overview, Brokers, Topics, and Consumers. The right side displays an overview of brokers and topics.
-
In the left-side navigation pane, click Topics. On the topic list page, click + Add topic.
-
On the New topic page, set a topic name and the number of partitions, and then click Create with defaults.
For example, set Topic name to
transactionsand Number of partitions to1. -
After you create the topic, you are redirected to its details page.
The page includes four tabs: Overview, Messages, Schema, and Configuration. The Overview tab shows metrics such as Production, Consumption, and Availability.
Enable schema validation
Create a schema
-
On the topic details page, click the Schema tab, and then click Set a schema.
-
On the Schema tab, select a schema format, enter the validation rules, and then click Create.
Supported schema formats include JSON Schema, Avro, and Protobuf.
Enable schema validation
-
On the topic details page, click the Configuration tab, and then click Edit settings.
-
Then, click Switch to expert mode.
-
Set the confluent_value_schema_validation field to true and then click Save changes to enable schema validation for message content. After this feature is enabled, message formats are validated during production and consumption.
View broker details
-
In the left-side navigation pane of the Cluster overview page, click Brokers to view basic information about the brokers.
-
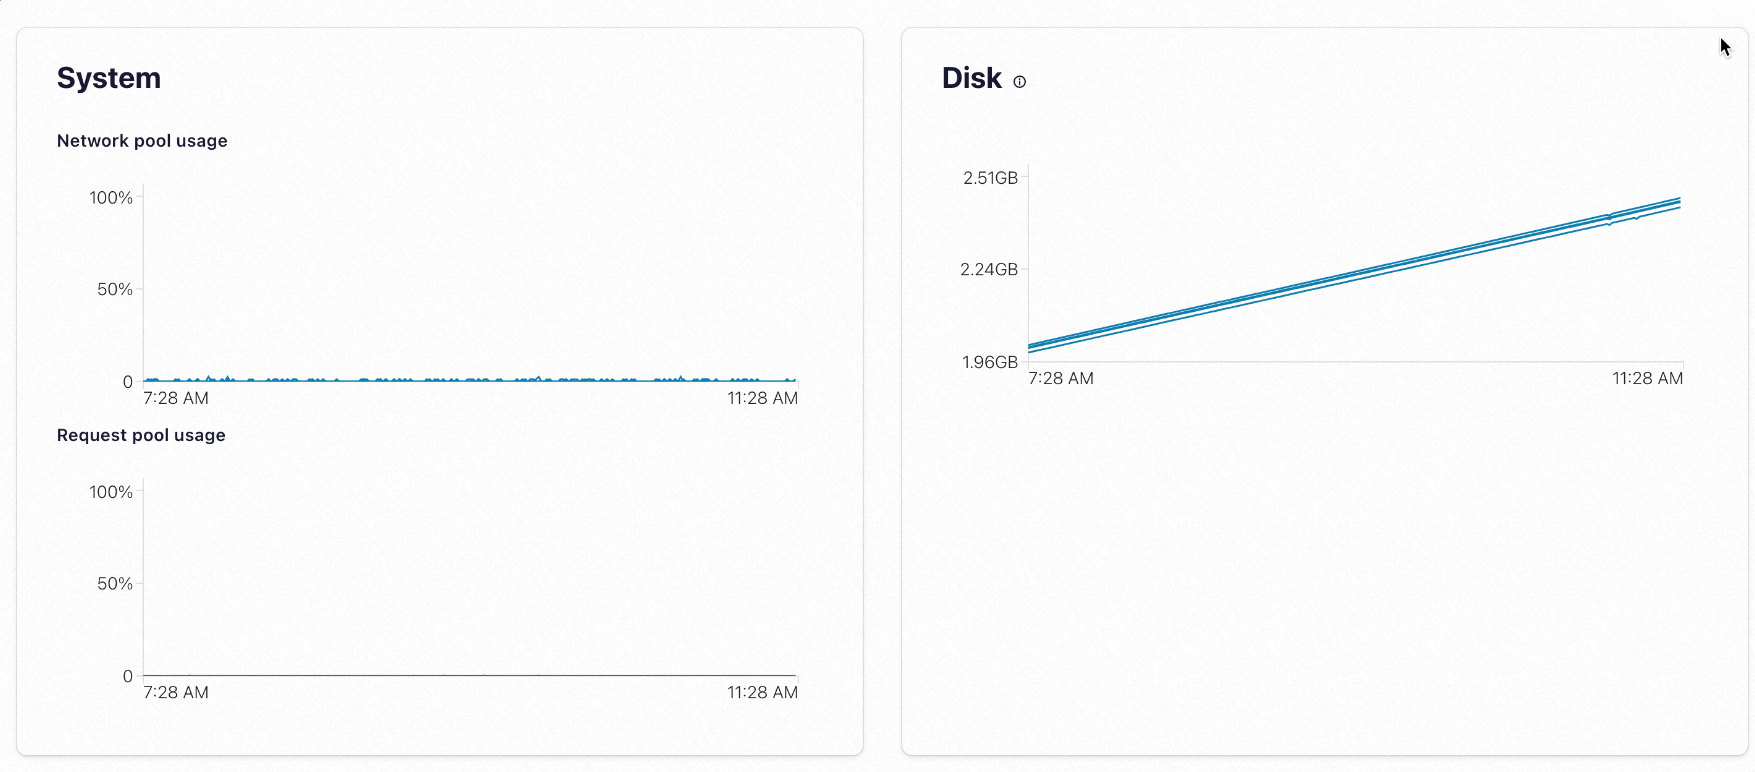
On the Brokers overview page, click Production or Consumption to view metrics such as producer and consumer throughput, request latency, and disk usage. Each column displays line charts for Throughput and Request latency 95th percentile.
Use ksqlDB
ksqlDB is an open-source streaming SQL engine that uses a SQL-like syntax to simplify real-time processing and analysis of Kafka data streams. For more information, see ksqlDB.
View cluster configuration
-
In the left-side navigation pane of the home page, click Cluster settings to view basic information about the cluster.
-
Click the Cluster defaults tab to view detailed information about the cluster, including the Controller, General, and Group Management modules.
RBAC authorization
Role-based access control (RBAC) is a core permission management feature of ApsaraMQ for Confluent. For more information, see RBAC authorization.
Configure alerts
You can configure business alerts in ApsaraMQ for Confluent. For more information, see Configure alerts in Control Center.
Manage other resources
To manage other resources such as topics and consumer groups, see the official Confluent documentation.