Continuous profiling discovers bottlenecks caused by CPU, memory, and I/O in your Java applications. It provides detailed statistics broken down by method name, class name, and line number. This helps you pinpoint resource-intensive methods, optimize code, reduce latency, increase throughput, and lower infrastructure costs. This topic describes how to enable continuous profiling in ARMS and view the profiling data.
The continuous profiling feature has minimal performance overhead. In benchmarks on a mainstream Spring Web application with all features enabled, CPU utilization increased by about 5%, off-heap memory usage increased by about 50 MB, and GC and request latency showed no significant increase. For detailed results, see Performance test report of the continuous profiling feature for ARMS Java agent v4.x.
Prerequisites
-
Only Pro Edition and the pay-by-observable-data billing mode support continuous profiling. To activate Pro Edition, see Pay-as-you-go. To switch to the pay-by-observable-data billing mode, see Billing.
-
Continuous profiling is not yet available in some regions for Finance Cloud and Government Cloud. To use this feature, contact the user group (ID: 22560019672) to request access.
-
Continuous profiling data is retained for 7 days.
-
Your application is connected to ARMS Application Monitoring, and its agent is version v2.7.3.5 or later. For instructions on connecting your application, see Application Monitoring overview. To upgrade the agent, see Update the ARMS agent.
-
If your application's VPC has an access control policy restricting access to OSS buckets, you must grant access to the ARMS profiling bucket. Continuous profiling uploads collected data to a centralized ARMS OSS bucket for storage and processing. Without this access, data collection fails. You must add the bucket named
arms-profiling-<regionId>to your policy rules. Replace<regionId>with the ID of your application's region. For example, if your application is deployed in the China (Hangzhou) region, the bucket isarms-profiling-cn-hangzhou. -
Continuous profiling currently supports only OpenJDK and Oracle JDK. IBM OpenJ9 and Oracle GraalVM JDK are not supported.
Limitations
Operating system kernel
Linux 2.6.32-431.23.3.el6.x86_64 or later.
Run the uname -r command to check your kernel version.
JDK version
ARMS continuous profiling uses the Java Virtual Machine Tool Interface (JVM TI) to capture the application's method stack, providing details on CPU and memory usage during runtime. JVM TI has a known crash issue that can cause application crashes. This issue has been fixed in OpenJDK 8u352, 11.0.17, 17.0.5 and later, and Oracle JDK 11.0.21, 17.0.9 and later. For JDK versions without the fix, extensive tests by ARMS show that the issue occurs only in rare scenarios. Therefore, ARMS does not automatically disable continuous profiling if your JDK version is not on the recommended list. You can enable the feature temporarily and limit its scope by application IP address. However, for maximum application stability, upgrade to a supported JDK version. Using continuous profiling on older JDK versions poses a risk of application crashes.
Continuous profiling relies on the presence of debug symbols in the JDK. Alpine base images strip these debug symbols to reduce their size, preventing the feature from working. If you intend to use continuous profiling, use a non-Alpine base image.
Recommended JDK versions for continuous profiling:
|
Type |
Version |
|
OpenJDK |
|
|
Oracle JDK |
|
Enable continuous profiling in the ARMS console
-
Log on to the ARMS console. In the left-side navigation pane, choose .
On the Application List page, select a region from the top navigation bar, and then click the name of your application.
NoteThe icons in the Language column indicate the following:
 : A Java application monitored by Application Monitoring.
 : A Go application monitored by Application Monitoring.
 : A Python application monitored by Application Monitoring.
-: An application monitored by Managed Service for OpenTelemetry.
-
In the left-side navigation pane, click Application Settings, and then click the Custom Configurations tab.
-
On the Custom Configurations tab, in the Continuous profiling section, turn on the Main Switch and configure the IP white list or network segment address.
-
In the lower-left corner of the Custom Configurations tab, click Save.
View profiling data
-
Log on to the ARMS console. In the left-side navigation pane, choose .
On the Application List page, select a region from the top navigation bar, and then click the name of your application.
NoteThe icons in the Language column indicate the following:
: A Java application monitored by Application Monitoring.: A Go application monitored by Application Monitoring. : A Python application monitored by Application Monitoring.
-: An application monitored by Managed Service for OpenTelemetry.
-
In the left-side navigation pane, click Continuous profiling.
-
From the instance list on the left, select a target instance. Then, set the time range for the data on the right.
-
On the Search tab, you can filter data and perform an aggregate analysis.
-
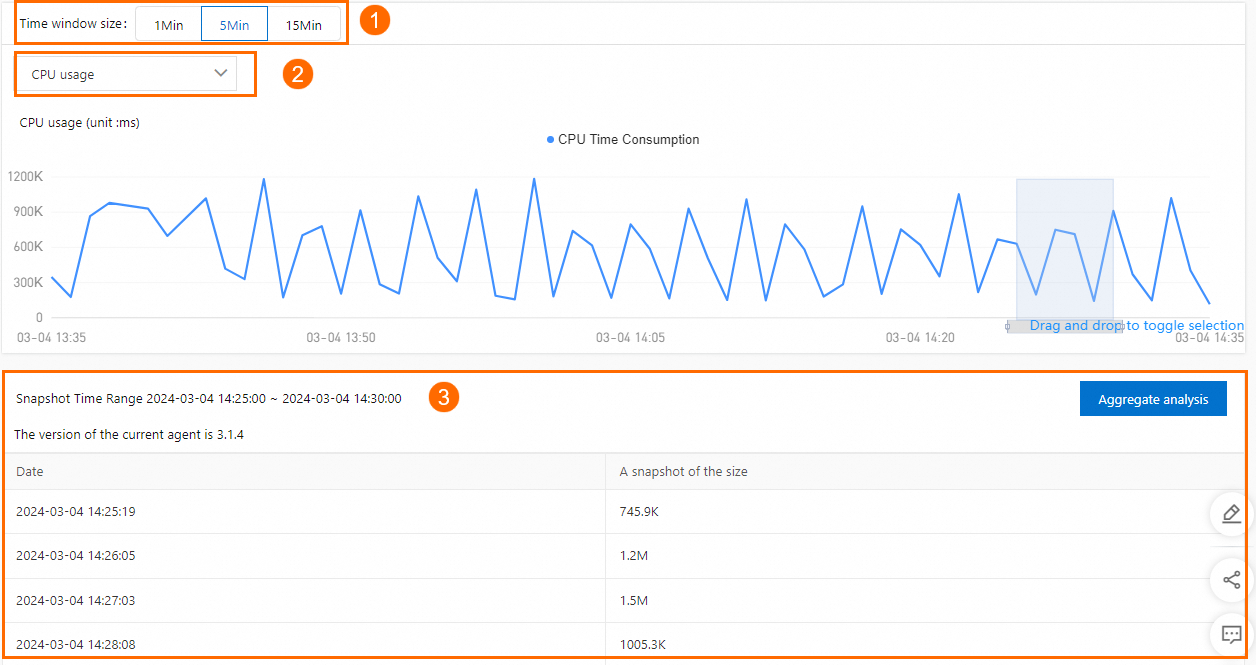
In the Time window size area (① in the figure), select a snapshot duration, and then click and drag on the chart to select a time range.
-
From the drop-down list (② in the figure), select a data type: CPU, JVM Heap, or JVM GC.
-
The area labeled ③ displays the data for the selected time range. Click Aggregation & Analysis in the upper-right corner to view snapshot details.
Figure 1. Performance analysis
-
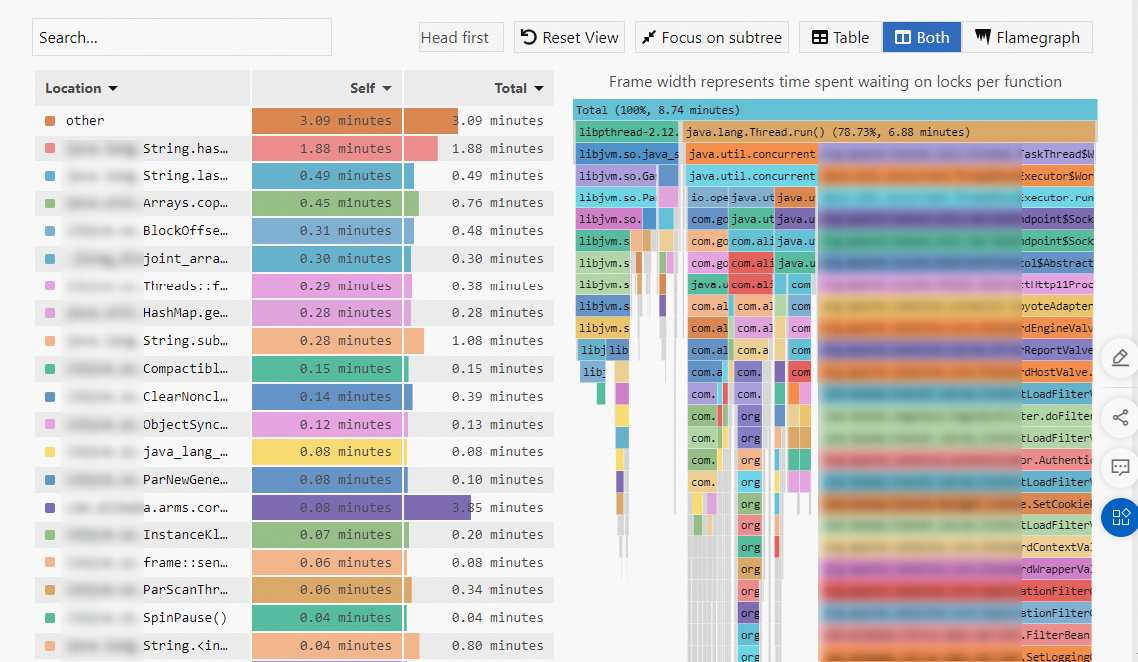
The Self column shows the time or resources a method consumes, excluding its child method calls. Use this column to identify methods that are individually expensive.
-
The Total column shows the time or resources a method consumes, including all of its child method calls. Use this column to identify call paths that contribute the most to overall resource usage.
To troubleshoot specific hotspot code, focus on the Self column or inspect the wide frames at the bottom of the flame graph on the right. A wide frame at the bottom typically indicates a resource-intensive method that is the root cause of high consumption in the upper layers of the stack. These frames often represent system bottlenecks, making them a primary focus for optimization.
Figure 2. Metrics
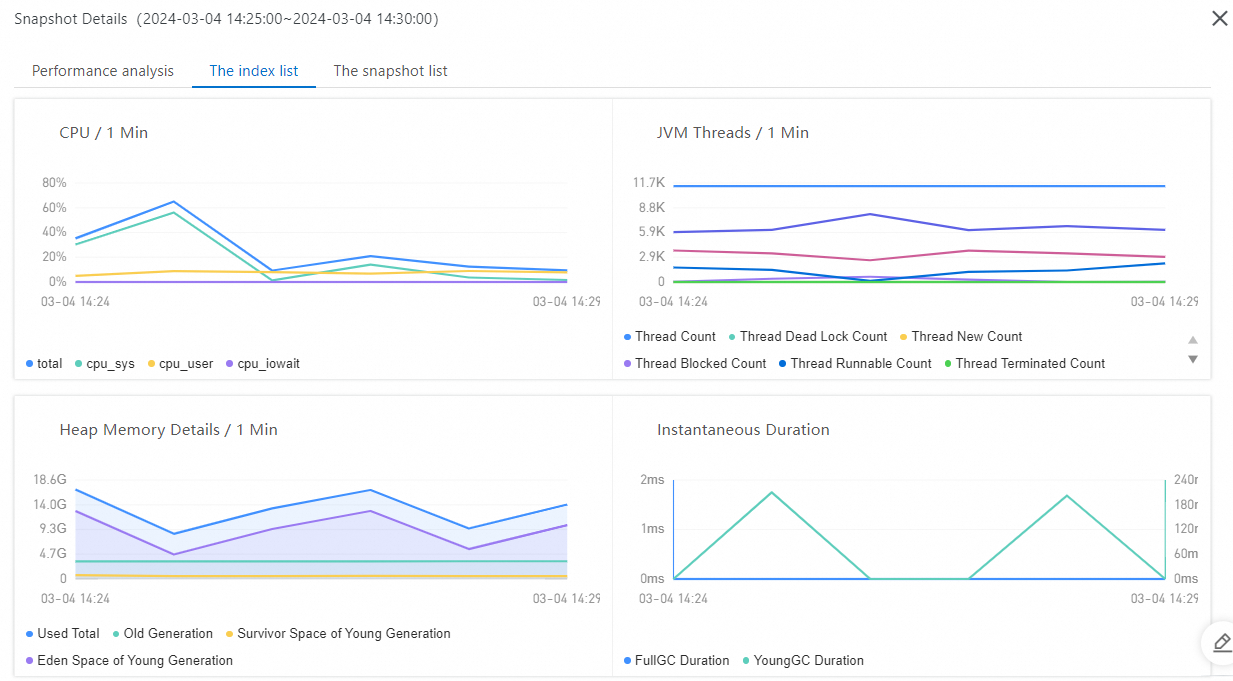
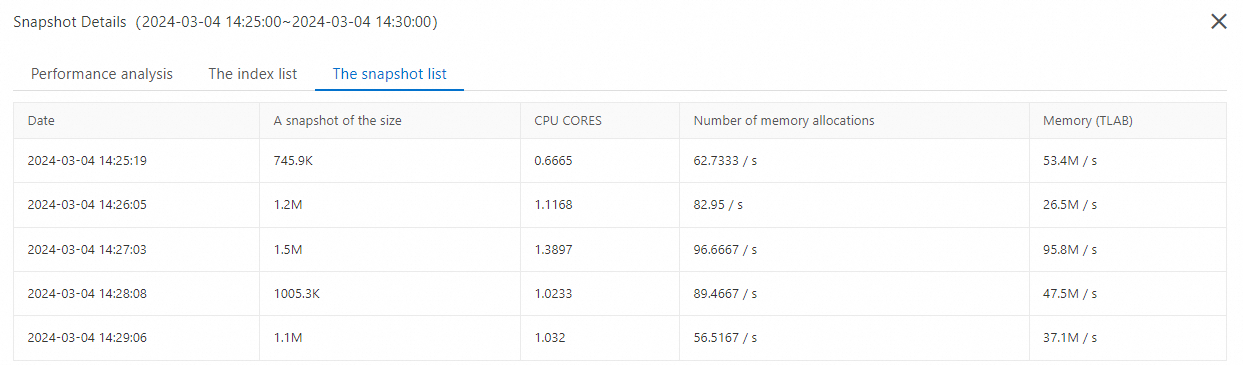
Figure 3. Snapshots
-
-
-
The Compare tab lets you compare and analyze data from two different time ranges or filter configurations.
References
For instructions on using continuous profiling to troubleshoot high CPU and memory utilization, see the following topics:
For common issues related to continuous profiling, see FAQ.