The data report feature in Managed Service for Grafana lets you export entire dashboards and schedule them for recurring, automatic delivery to specified email addresses.
This feature is available in the Pro Edition and Advanced Edition. If you are using the Developer Edition, upgrade to the Pro Edition or Advanced Edition to use this feature.
Prerequisites
This feature is available for Pro Edition and Advanced Edition workspaces. Ensure that your workspace is running one of these editions. You can enable or upgrade your workspace in the Managed Service for Grafana console. For more information, see Billing.
Access data reports
-
Log on to the ARMS console. In the left-side navigation pane, choose .
-
On the Workspace Management page, click the ID of the workspace that you want to manage.
-
In the left-side navigation pane, choose .
Export reports
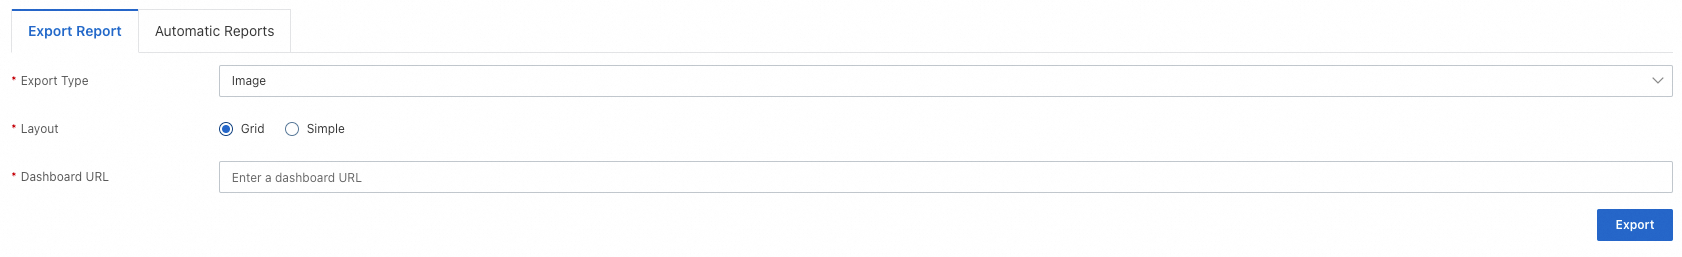
On the Export Report tab, configure the following parameters to export a dashboard.
|
Parameter |
Description |
|
Export Type |
The output format. Currently, only Image is supported. |
|
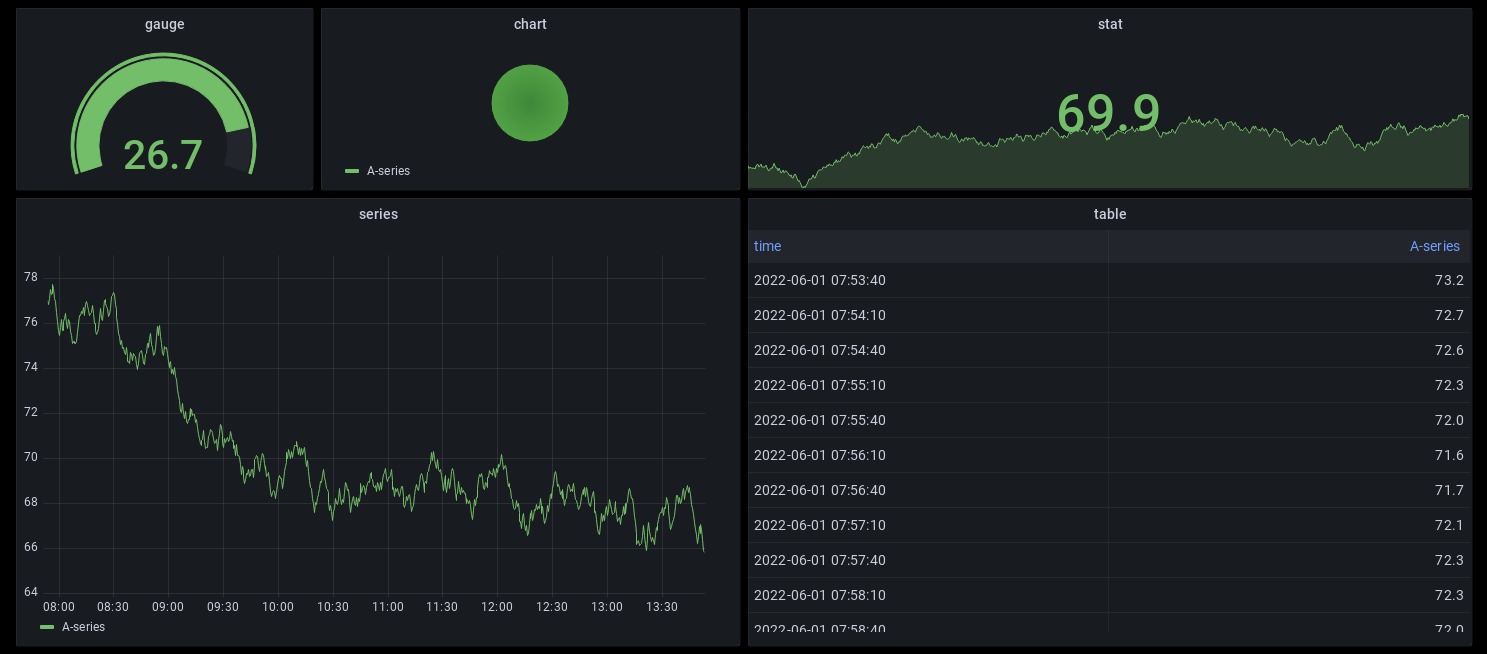
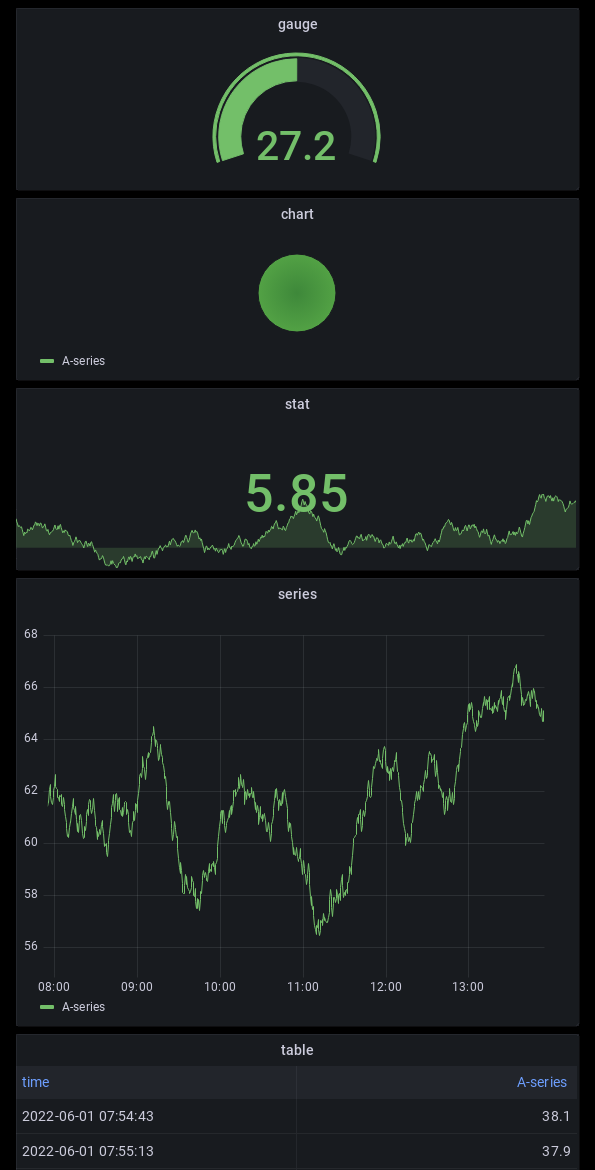
Layout |
|
|
Dashboard URL |
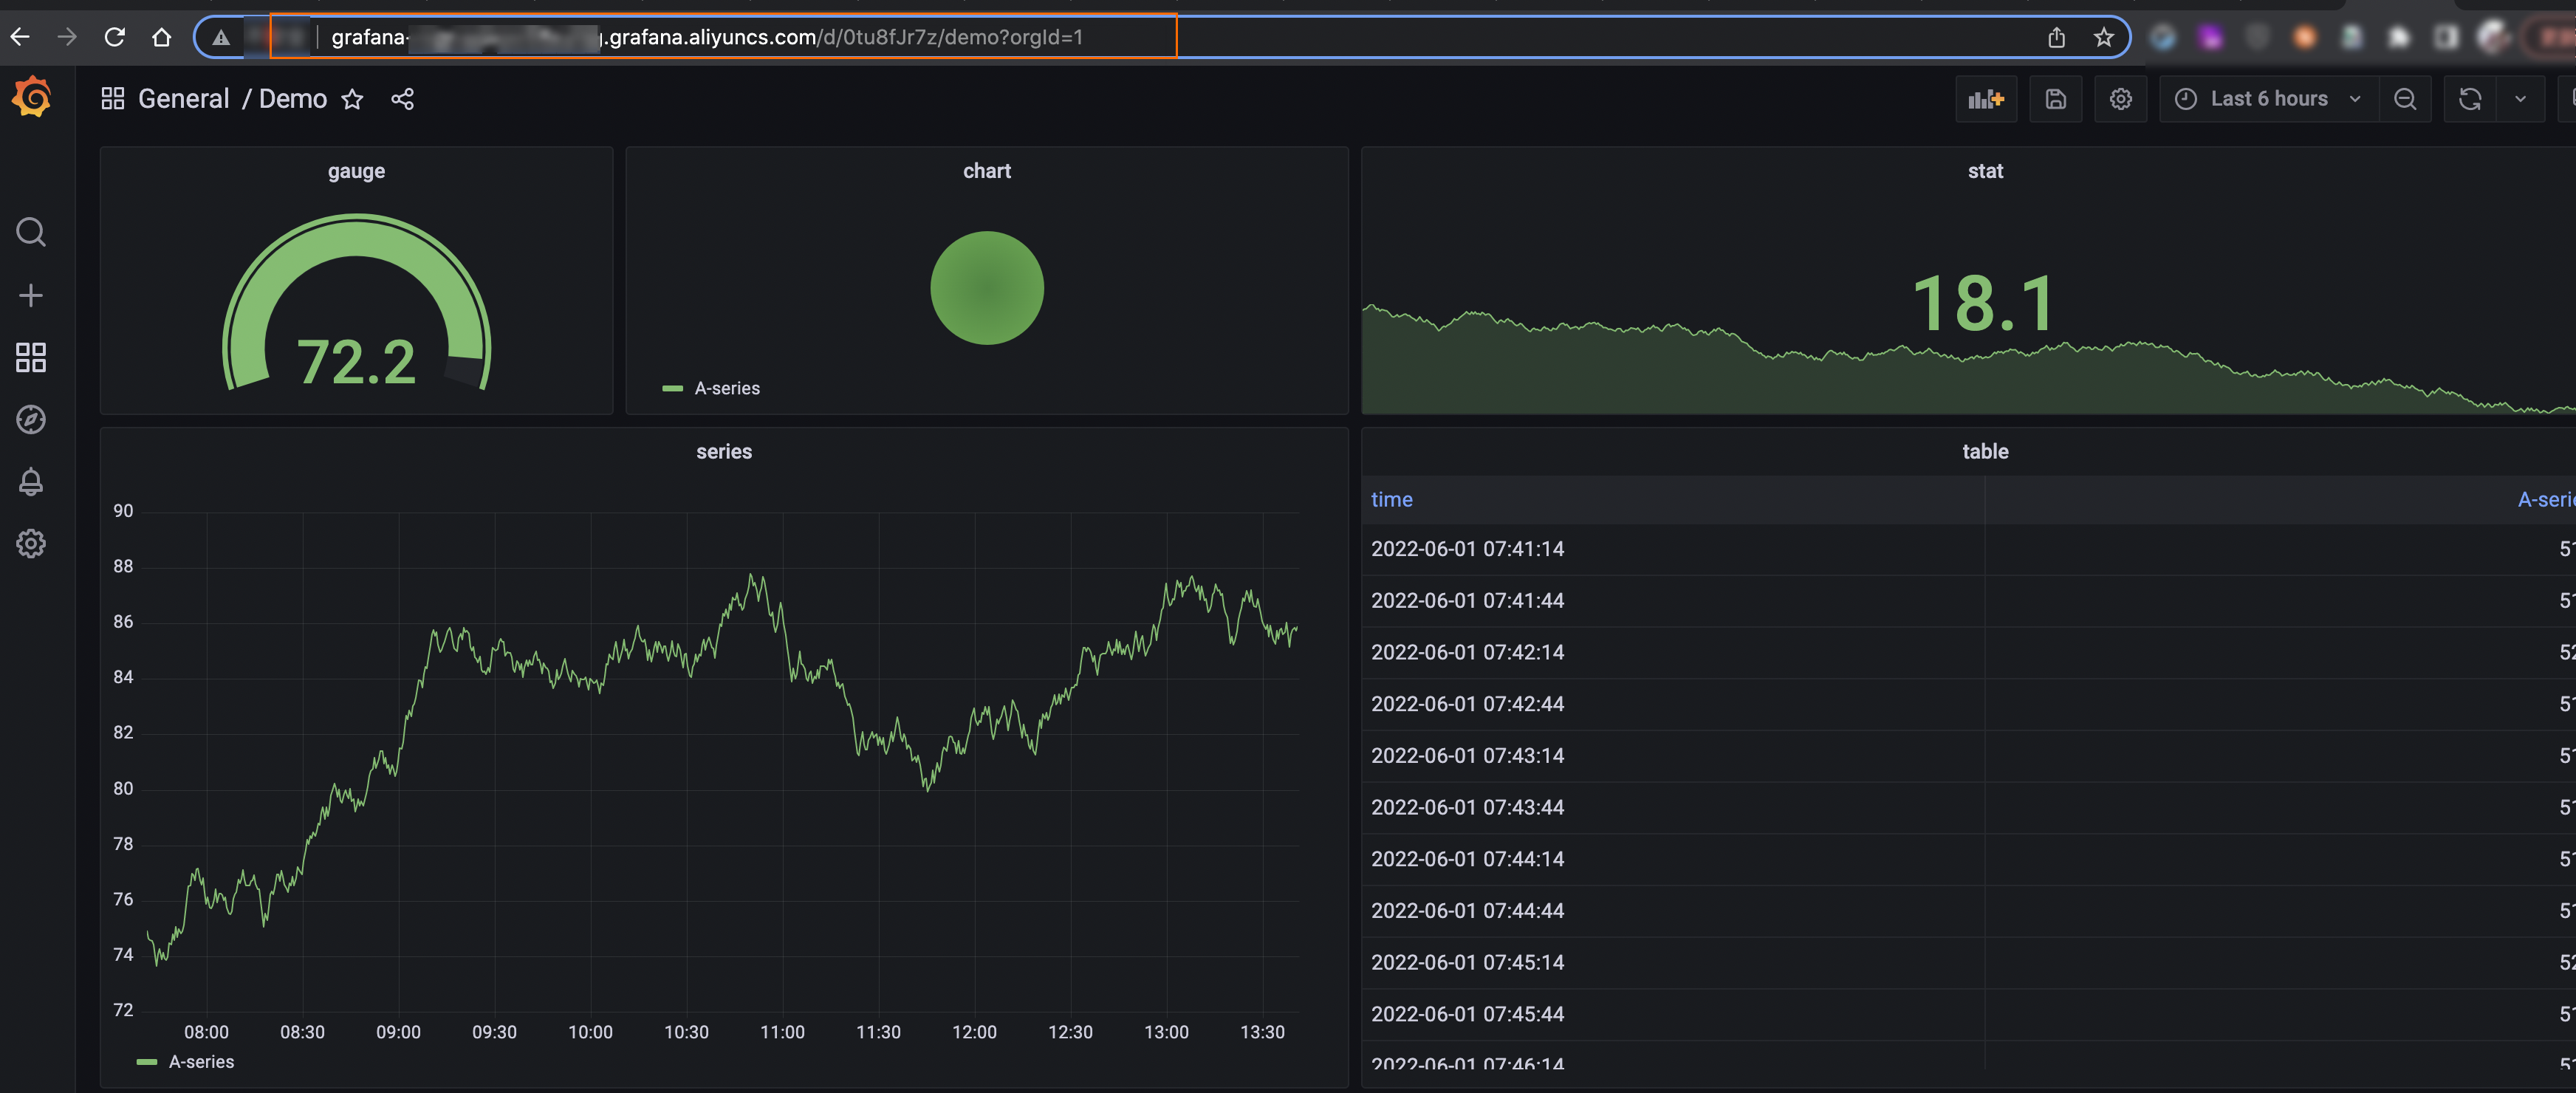
The URL of the dashboard that you want to export. You can copy the URL directly from the address bar of your browser. Note
The system may cancel the export task if a dashboard takes too long to load. To prevent this, adjust its query parameters. For more information, see dashboard settings.
|
Schedule automatic reports
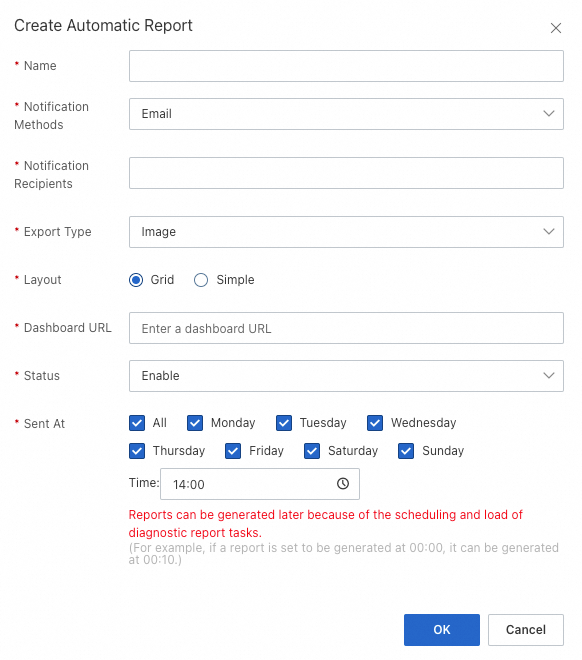
On the Automatic Reports tab, click Create Automatic Report and configure the following parameters.
|
Parameter |
Description |
|
Name |
The name of the scheduled task. |
|
Notification Channel |
Currently, only email is supported. |
|
Notification Recipients |
The recipient email addresses. Separate multiple addresses with a comma ( |
|
Export Type |
The output format. Currently, only Image is supported. |
|
Layout |
|
|
Dashboard URL |
The URL of the dashboard that you want to send. You can copy the URL directly from the address bar of your browser. Note
The system may cancel the export task if a dashboard takes too long to load. To prevent this, adjust its query parameters. For more information, see dashboard settings. |
|
Status |
The status of the scheduled task. |
|
Send Time |
The delivery schedule. You can set a weekly delivery time, down to the minute. |
After you create a scheduled task, it appears in a list on the Automatic Reports tab. From this list, you can view the task's status, modify its settings, or disable it.
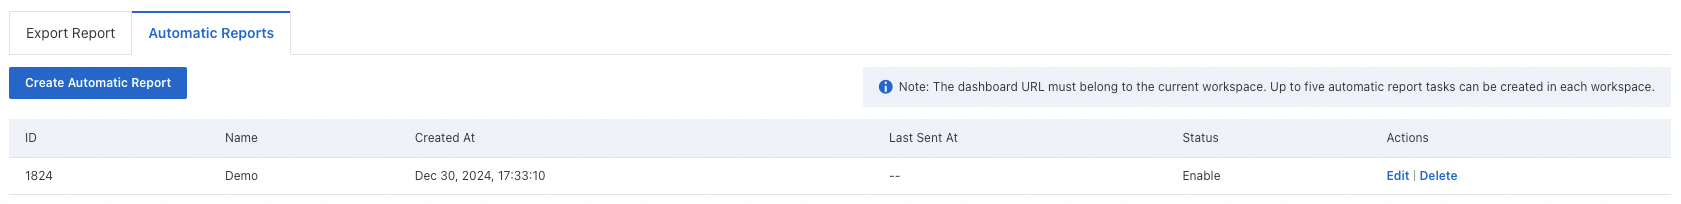
You can create a maximum of five scheduled tasks per workspace. If you reach this limit, you must delete an existing task before creating a new one.
Dashboard settings
A dashboard's URL contains its query parameters and time range. When you export a dashboard, ensure that the URL contains the correct parameters for the data you want to display.
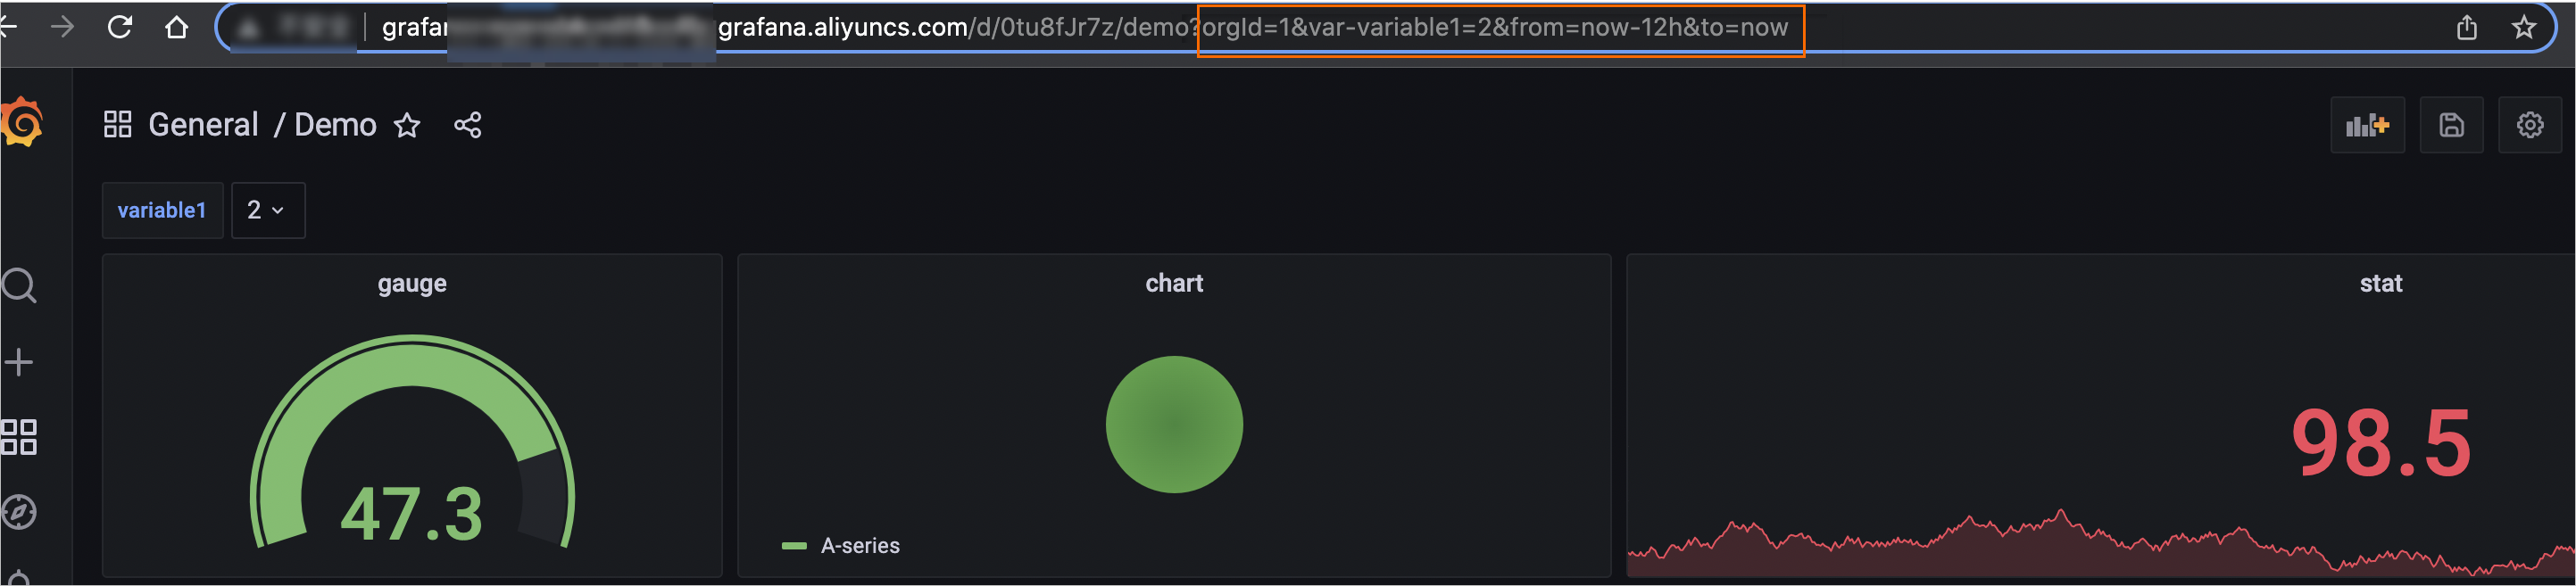
Dashboard rendering times out after 5 minutes. If a dashboard takes longer than this to load, the system cancels the export task. For successful exports, we recommend optimizing your dashboards to load in under 30 seconds.