This topic describes how to use Managed Service for Prometheus to monitor a Java application instrumented with Micrometer.
Prerequisites
A Java application.
Step 1: Instrument the Java application with Micrometer
This topic uses a Spring Boot 2.x application as an example.
-
Add the Spring Boot Actuator dependency to the pom.xml file.
<dependency> <groupId>org.springframework.boot</groupId> <artifactId>spring-boot-starter-actuator</artifactId> <verson>x.y.x</version> </dependency>NoteFor the latest version, search the Alibaba Cloud repository.
-
Configure Actuator to expose the Prometheus monitoring endpoint and scope by adding the following properties to the application.properties file.
management.server.port=8080 management.endpoints.web.exposure.include=xxx, prometheus -
Add the Micrometer dependency to the pom.xml file.
<dependency> <groupId>io.micrometer</groupId> <artifactId>micrometer-registry-prometheus</artifactId> <version>x.y.z</version> </dependency>NoteFor the latest version, search the Alibaba Cloud repository.
-
Add the Micrometer JVM Extras dependency to the pom.xml file.
<dependency> <groupId>io.github.mweirauch</groupId> <artifactId>micrometer-jvm-extras</artifactId> <version>0.2.2</version> </dependency>NoteFor the latest version, search the Alibaba Cloud repository.
-
Configure Micrometer JVM Extras. Add the following two Spring bean definitions to expose additional memory and thread-related metrics.
/* With Spring */ @Bean public MeterBinder processMemoryMetrics() { return new ProcessMemoryMetrics(); } @Bean public MeterBinder processThreadMetrics() { return new ProcessThreadMetrics(); } -
Deploy the Java application to Container Service for Kubernetes (ACK) or an ECS instance.
Deploy the Java application to ACK or an ECS instance. After a successful deployment, verify that metrics are exposed correctly by accessing the application's listening address, such as
http://localhost:8080/actuator/prometheus. The port 8080 is specified in the application.properties file. Replace the port in the URL with your actual port number.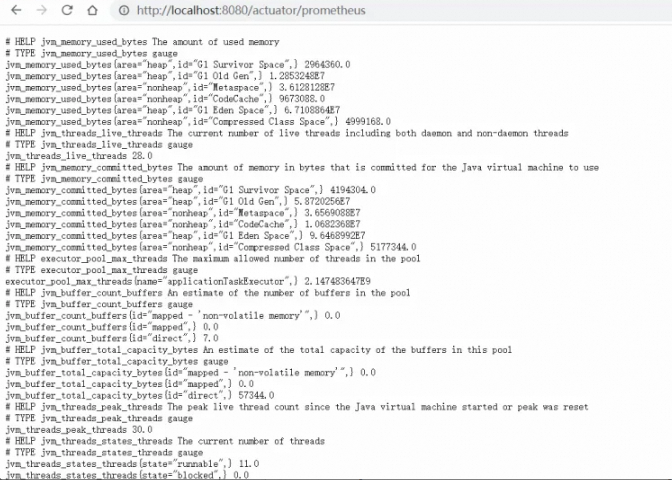
Step 2: Integrate with Micrometer
-
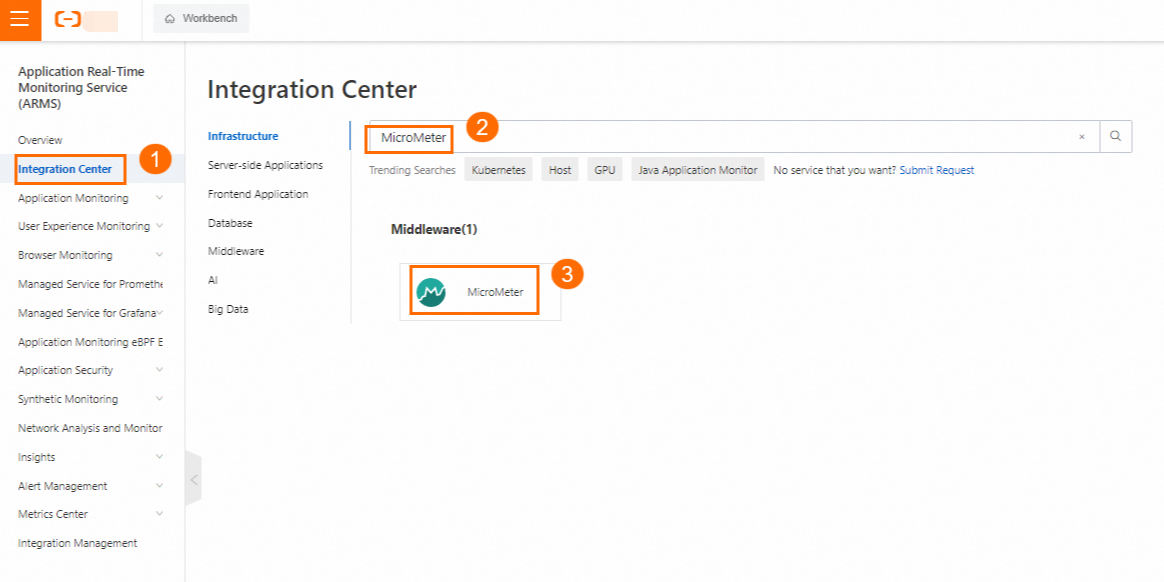
Log on to the ARMS console. In the left-side navigation pane, choose Integration Center. On the Integration Center page, search for and click Micrometer.
-
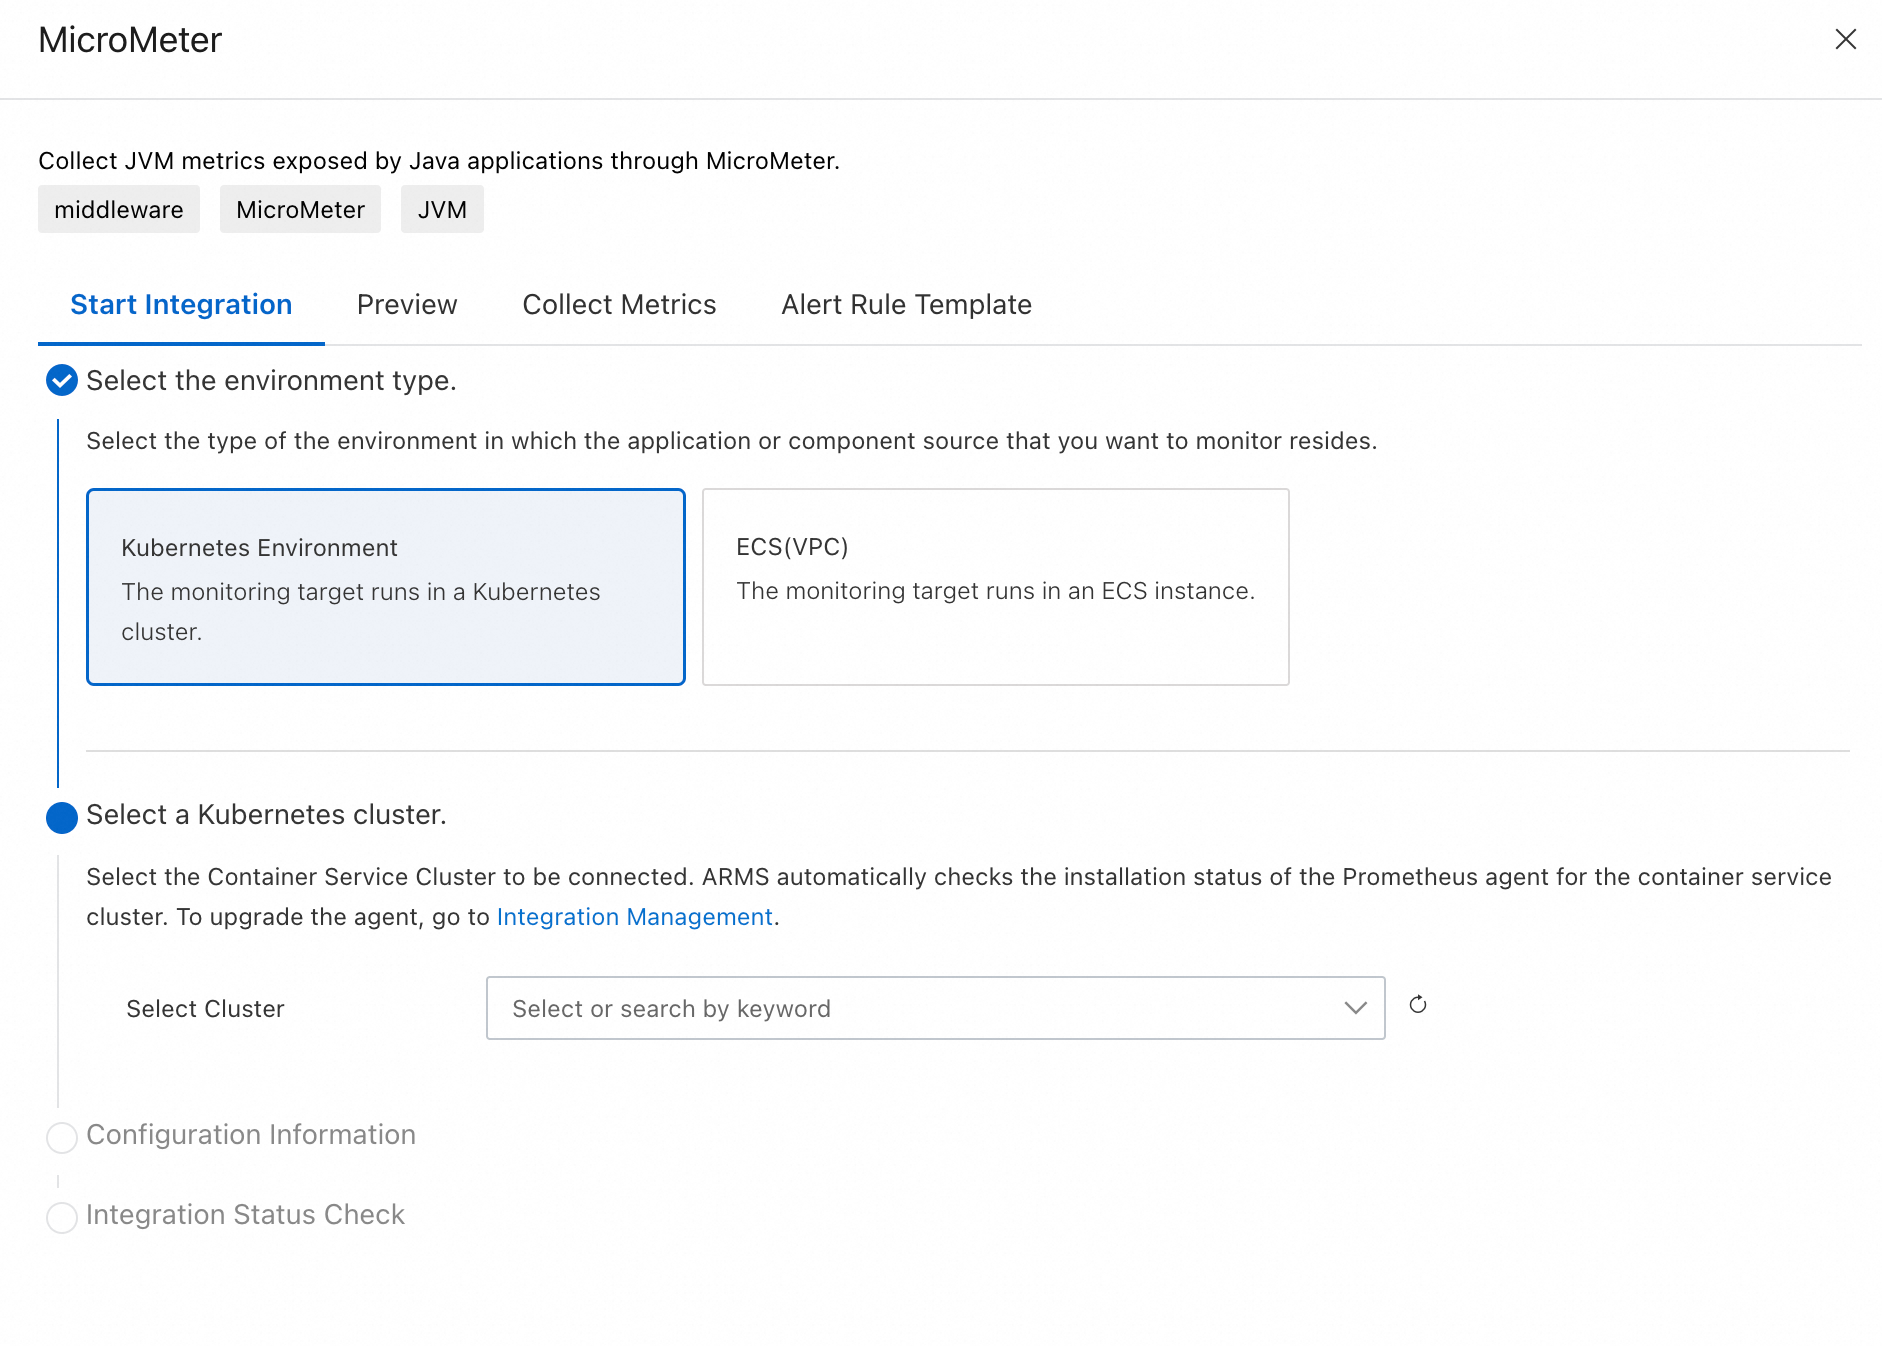
On the Start Integration tab of the Micrometer panel, make a selection for Select the environment type., complete the integration settings, and then click OK.
Parameter
Description
Select the environment type.
The type of environment where your application is running. You can integrate with the following two environment types:
-
Kubernetes environment
-
ECS (VPC)
Select a Kubernetes cluster.
Select the target cluster.
Pod label
The pod label used to discover the pods of your Micrometer application. Use a specific label for easy identification.
Service port
The port of the Java application. The default port number is automatically populated.
Metrics collection path
The path from which Micrometer metrics are exposed. The default path is automatically populated.
Use HTTPS to collect data
By default, metrics are collected over the HTTP protocol. If your service supports HTTPS and you want to collect data over HTTPS, turn on this switch.
Metric scrape interval (seconds)
The interval at which Managed Service for Prometheus scrapes metrics. The default value is 30 seconds.
-
Step 3: View Micrometer dashboards
-
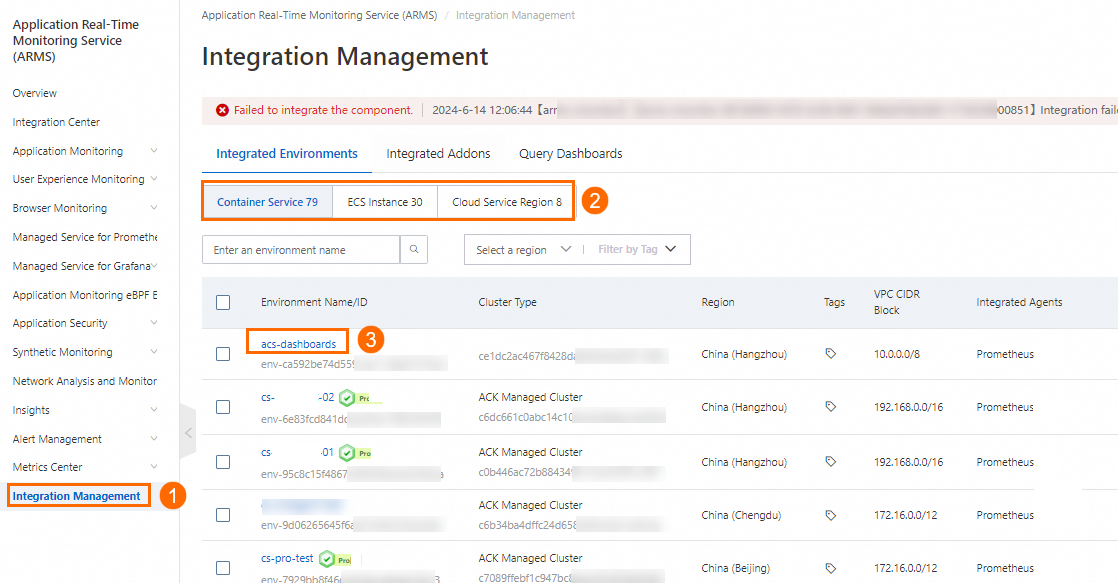
Log on to the ARMS console. In the left-side navigation pane, click Integration Management. On the Integration Management page, click the Integrated Environments tab, select your target environment, and then click its name to go to the details page.
-
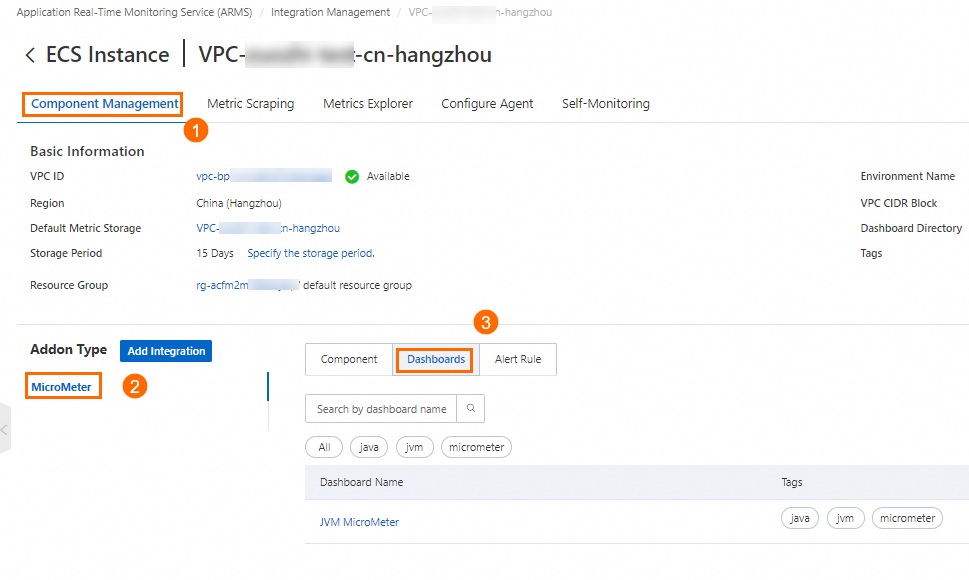
On the Component Management tab, find the Micrometer component in the Addon Type section and click Dashboard to view the available dashboards.
-
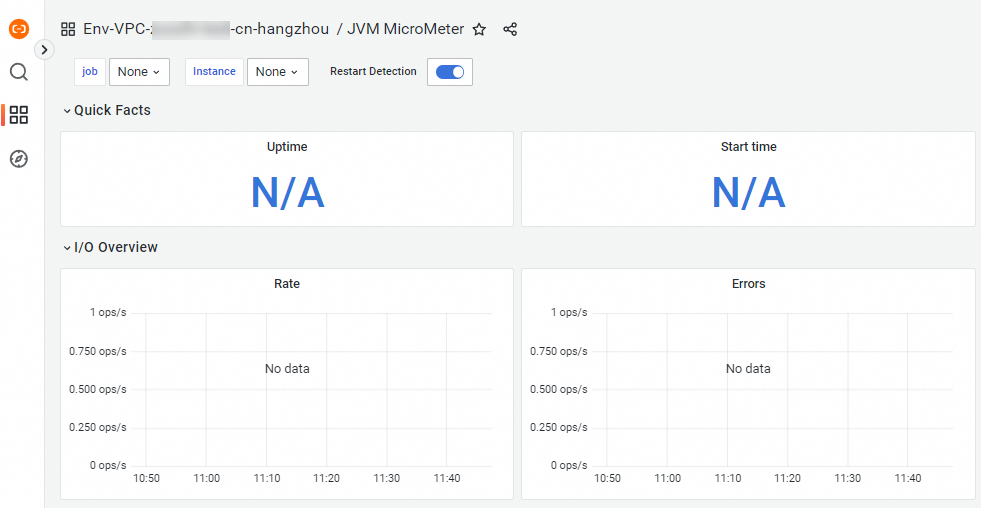
Click a dashboard name to view the corresponding Grafana dashboard.

Step 4: Configure Micrometer alerting
-
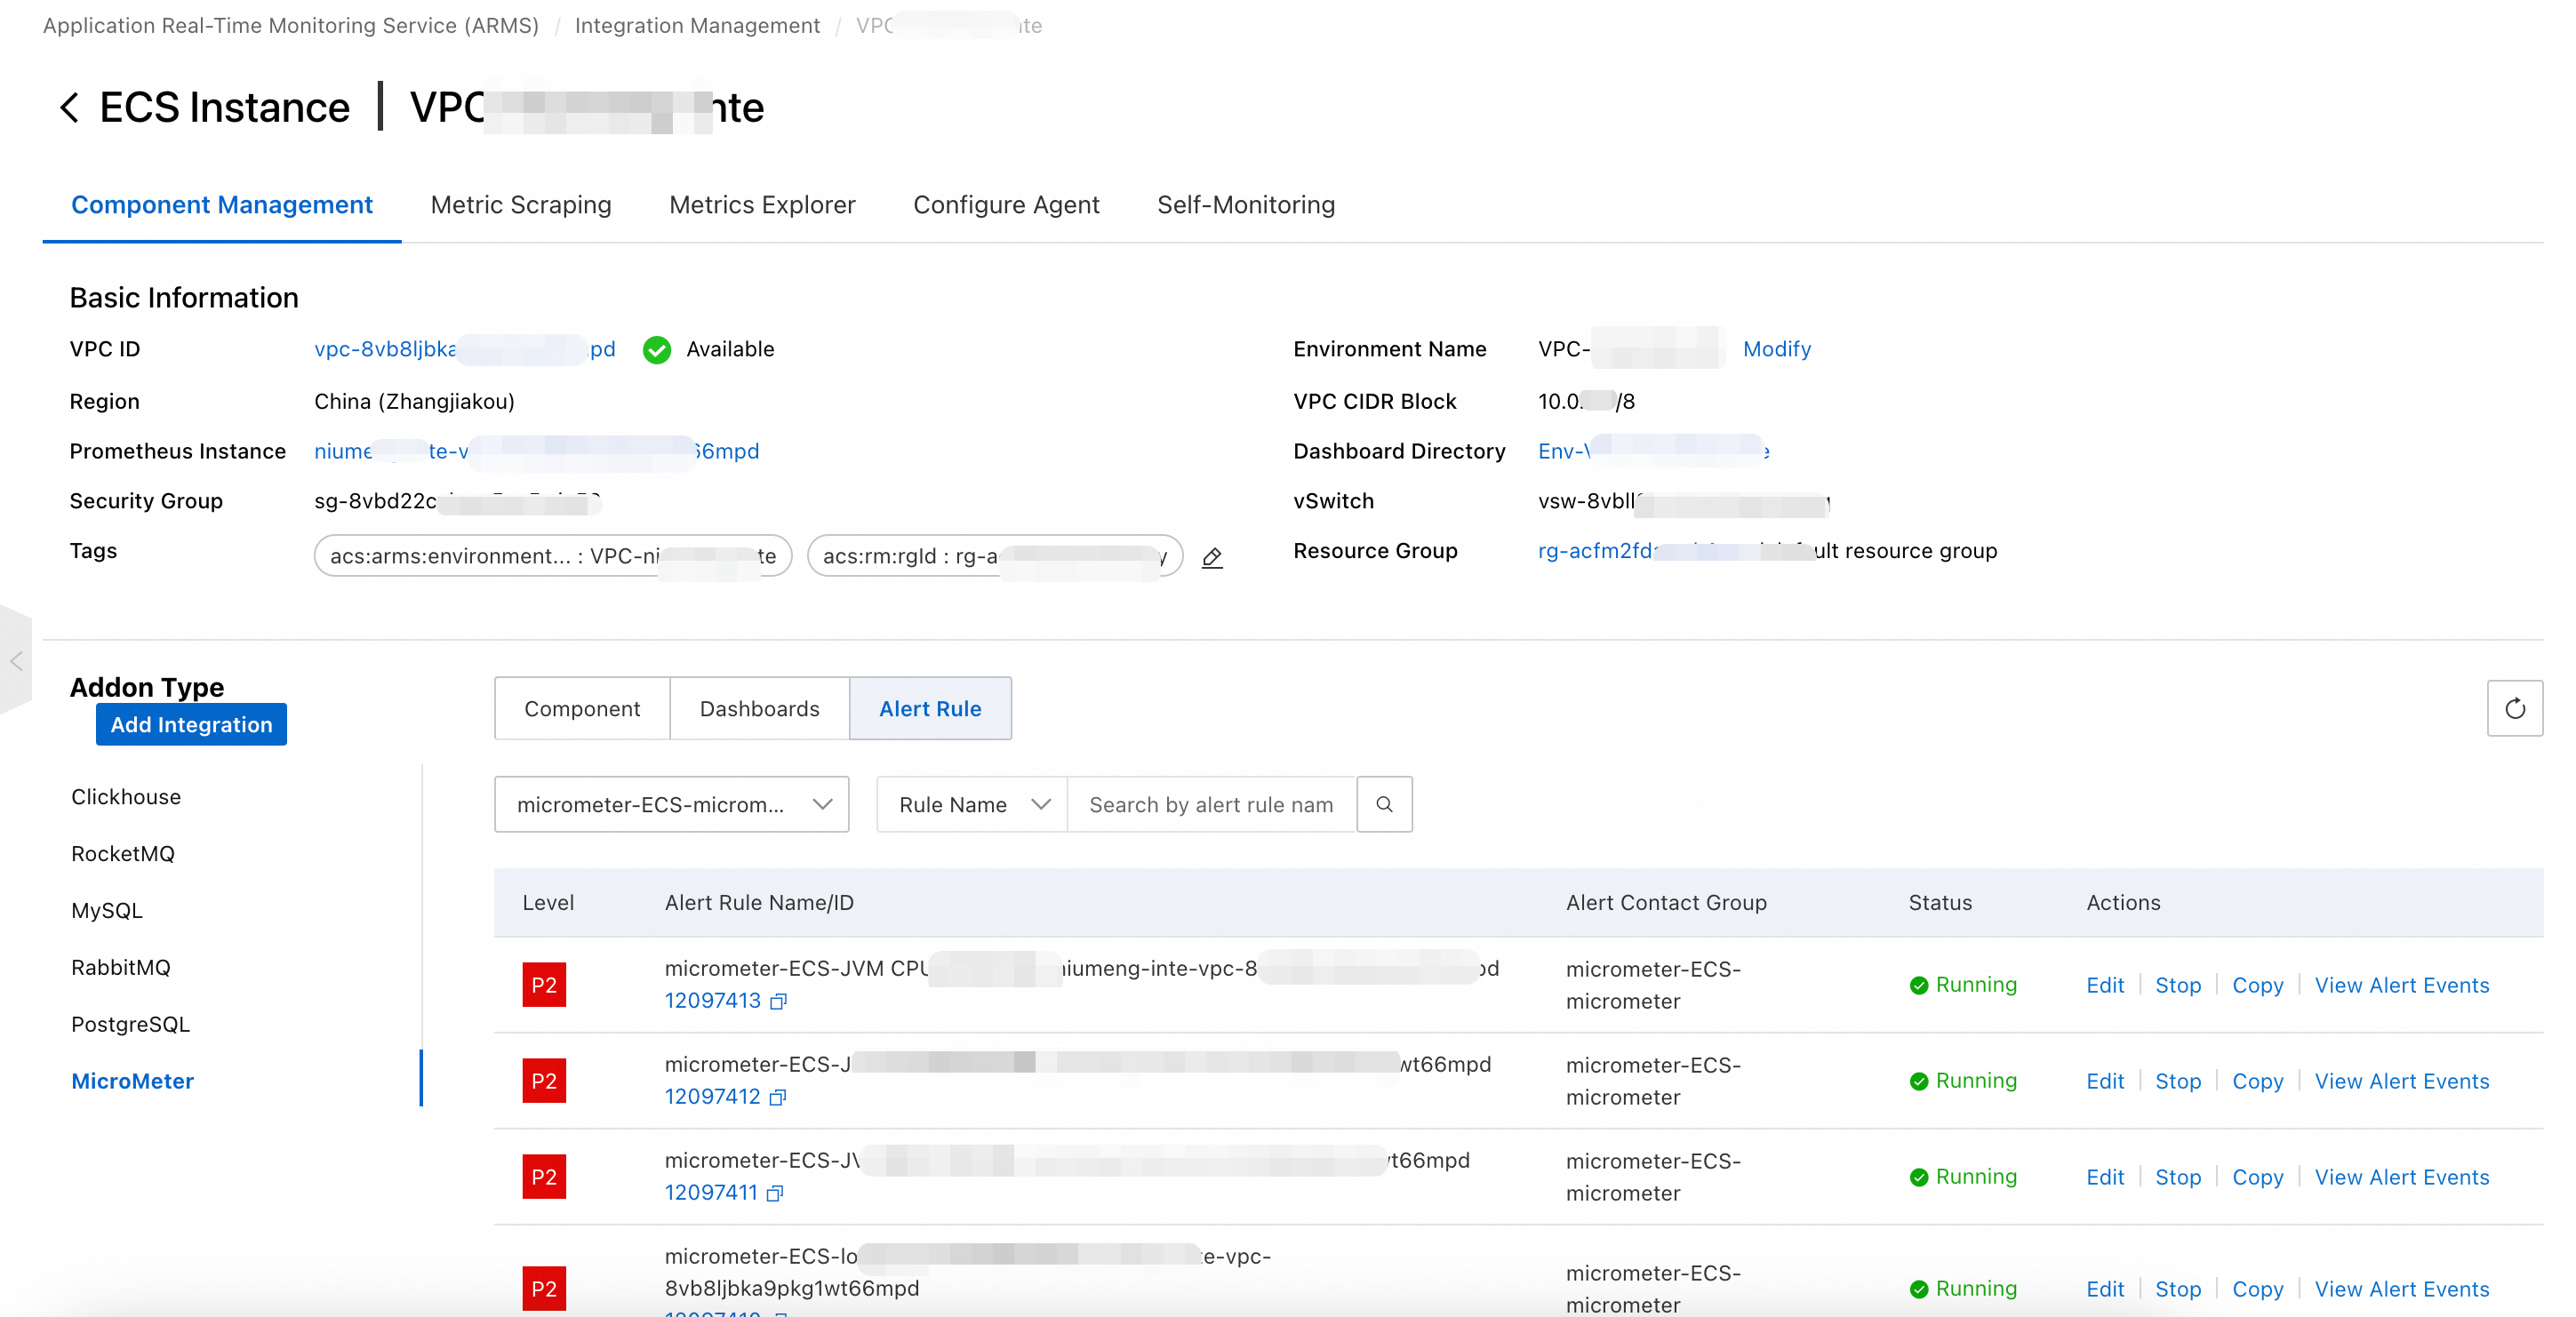
On the Component Management tab, find the Micrometer component in the Addon Type section and click Alarm Rules to view the default alert rules.
-
You can also add alert rules based on your business requirements. For more information about how to create Prometheus Alarm Rules, see Create Prometheus alert rules.