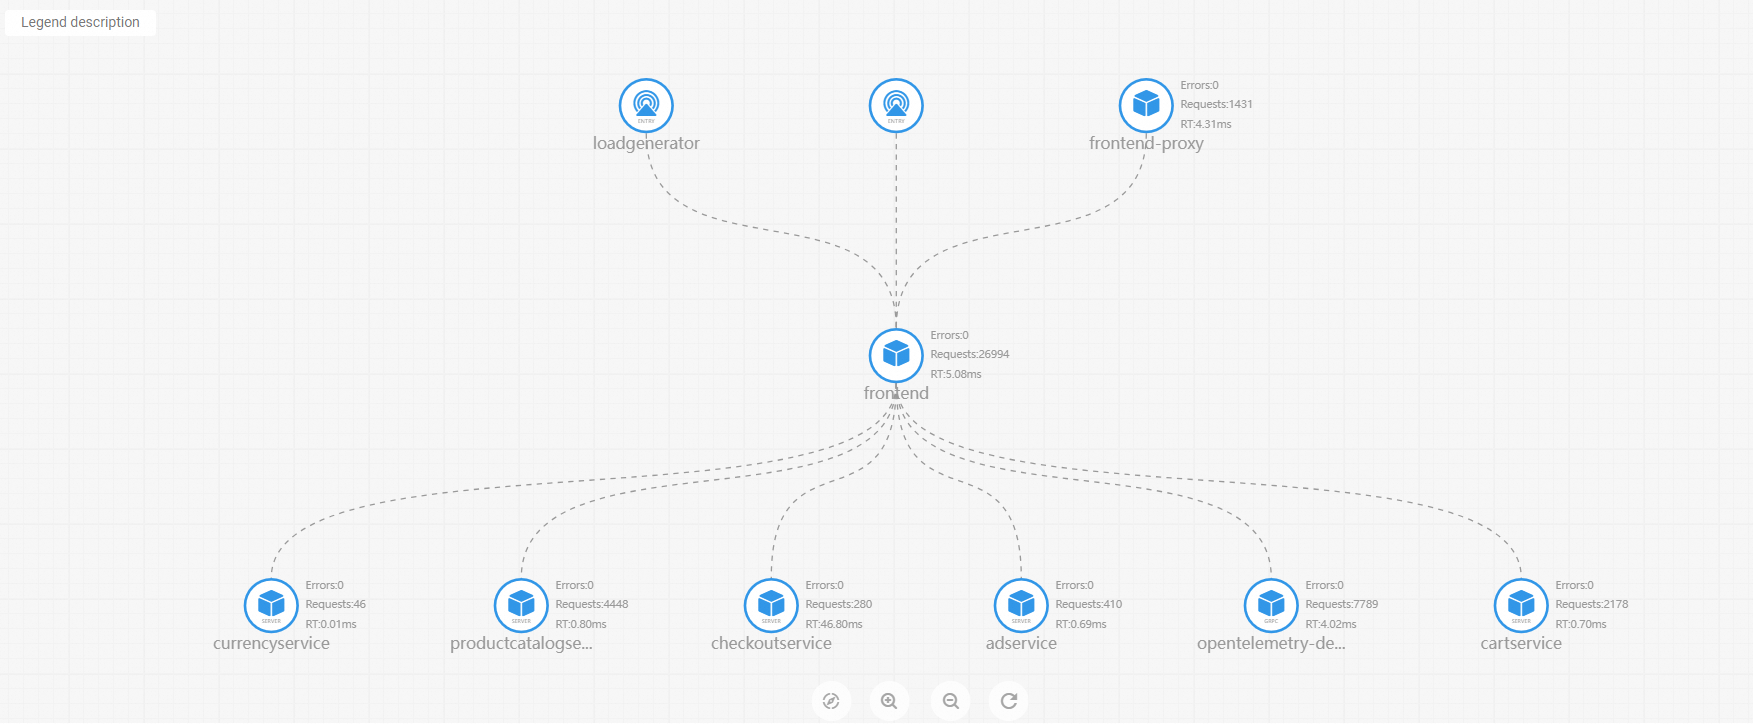
Application topology
In microservice architectures, understanding how services depend on each other helps you diagnose failures and optimize performance. After you report application data to Managed Service for OpenTelemetry, the Topology tab displays the topological relationships among your application's internal services, so you can identify upstream and downstream dependencies.
Prerequisites
Before you begin, ensure that you have:
Reported your application data to Managed Service for OpenTelemetry. For details, see Connection Description
View the application topology
Log on to the . In the left-side navigation pane, choose Application Monitoring > Application List.
On the Application List page, select a region in the top navigation bar, then click the name of the application that you want to monitor.
The Language column indicates the monitoring connection type. A
 icon means the application is connected through Application Monitoring. A hyphen (-) means the application is connected through Managed Service for OpenTelemetry.
Click the Topology tab.
The topology map displays the relationships among the internal services of your application for the selected time range.