After you instrument an application by using SkyWalking and report its trace data to Managed Service for OpenTelemetry, Managed Service for OpenTelemetry starts to monitor the application. You can view a series of monitoring data, such as application topology, call traces, exception transactions, slow transactions, and SQL analysis. This topic describes how to use the SkyWalking .NET Core SDK to instrument an application and report its data.
Prerequisites
-
Log on to the ARMS console. In the left-side navigation pane, click Integration Center.
-
On the Integration Center page, click the SkyWalking card in the Server-side Applications section.
-
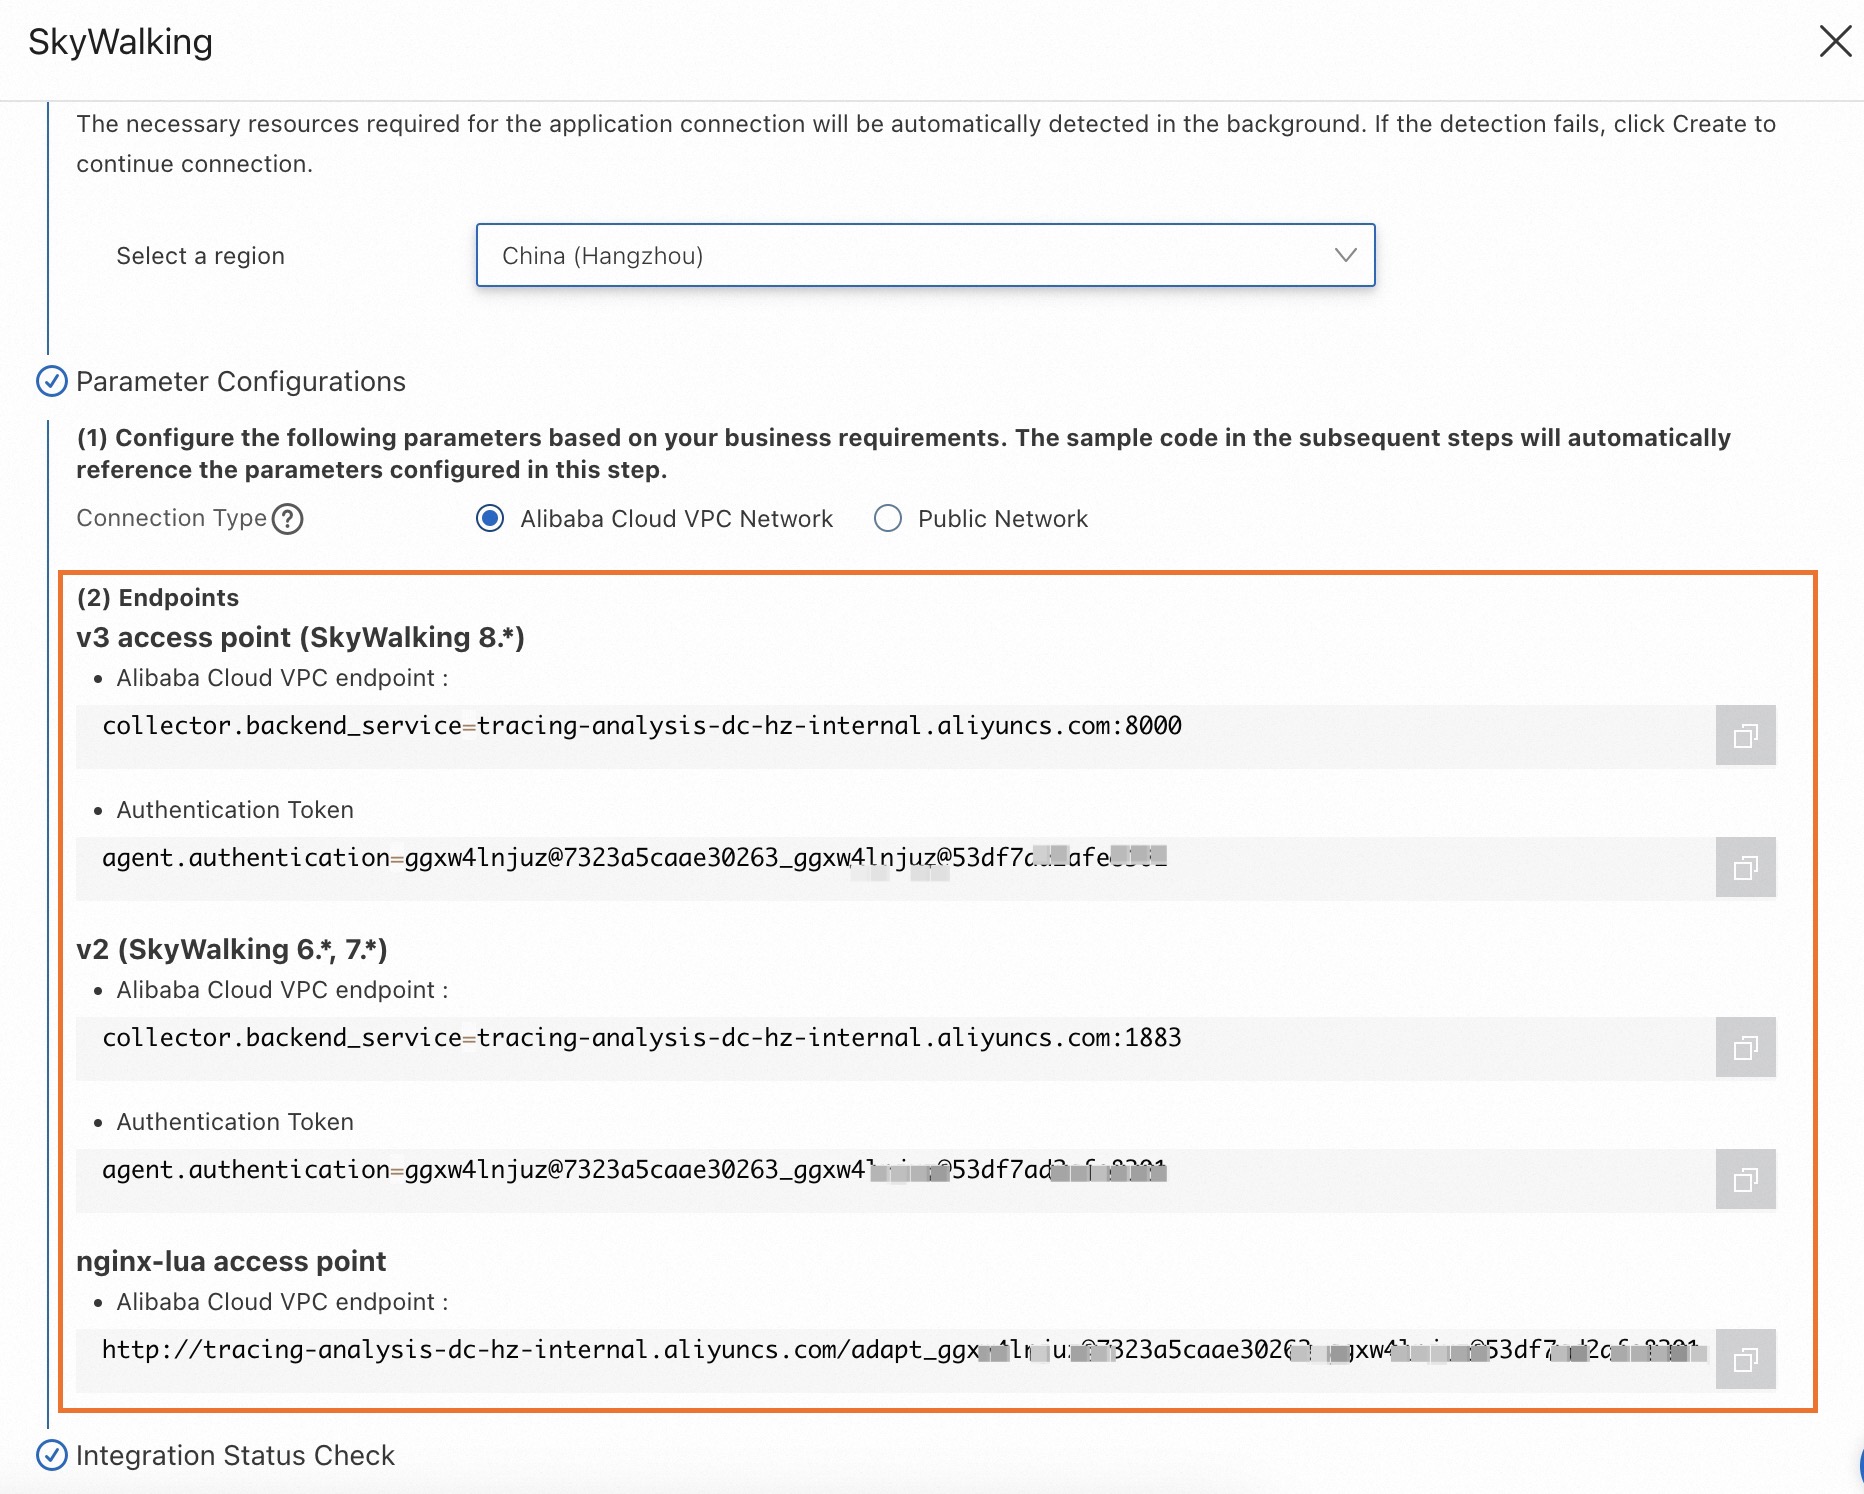
In the SkyWalking panel, click the Start Integration tab, and then select a region in which you want to report data.
NoteWhen you access a region for the first time, resources are automatically initialized there.
-
Configure the Connection Type parameter and copy an endpoint.
If your service is deployed on Alibaba Cloud and resides in the region that you selected, we recommend that you set this parameter to Alibaba Cloud VPC Network. Otherwise, set this parameter to Public Network.
Background information
SkyWalking is an open-source application performance monitoring (APM) tool for microservices, cloud-native, and container-based architectures like Docker, Kubernetes, and Mesos. At its core, SkyWalking is a distributed tracing system.
Sample demo
For a complete working example, see the SkyWalking Demo repository.
Instrument a .NET application with SkyWalking
-
Install the .NET agent.
Navigate to your project's root directory and run the following commands.
# Install the .NET Agent dotnet add package SkyAPM.Agent.AspNetCore # Add environment variables export ASPNETCORE_HOSTINGSTARTUPASSEMBLIES=SkyAPM.Agent.AspNetCore export SKYWALKING__SERVICENAME=<service-name> -
Configure the .NET agent properties.
Create a
skyapm.jsonfile using one of the following methods.-
Method 1: Use the SkyAPM.DotNet.CLI tool to generate the property configuration file.
dotnet tool install -g SkyAPM.DotNet.CLI
# Set the environment variable. Replace /path/to with the path to your .dotnet/tools directory.
export PATH="$PATH:/path/to/.dotnet/tools/"
dotnet skyapm config <service-name> <endpoint>
Method 2: Create a
skyapm.jsonfile in your project's root directory and copy the following content into the file.{ "SkyWalking": { "ServiceName": <service-name>, "Namespace": "", "HeaderVersions": [ "sw8" ], "Sampling": { "SamplePer3Secs": -1, "Percentage": -1.0, "LogSqlParameterValue": false }, "Logging": { "Level": "Information", "FilePath": "logs/skyapm-{Date}.log" }, "Transport": { "Interval": 3000, "ProtocolVersion": "v8", "QueueSize": 30000, "BatchSize": 3000, "gRPC": { "Servers": <endpoint>, "Authentication": <token>, "Timeout": 100000, "ConnectTimeout": 100000, "ReportTimeout": 600000 } } } }Parameters
-
Required parameters
-
<service-name>: The service name. -
<endpoint>: The endpoint obtained in the "Prerequisites" section. -
<token>: The authentication token for the endpoint. Obtain this token as described in the "Prerequisites" section.
-
-
Optional parameters
-
SamplePer3Secs: The number of samples to collect every three seconds. -
Percentage: The sampling percentage. For example, to sample 10% of traces, set this value to 10. -
Logging: Configures logging and debugging.Levelspecifies the log level, andFilePathspecifies the location and name of the log file.
-
-
-
Restart your .NET project.
dotnet run
-
Check the local agent logs. When you run the project, a
skyapm-<date>.logfile is generated in thelogsfolder. If data reporting fails, you can use this log file to debug the issue.2023-07-27 10:04:08.396 +08:00 [skywalking-net-demo] [Information] SkyApm.InstrumentStartup : Initializing ... 2023-07-27 10:04:08.477 +08:00 [skywalking-net-demo] [Information] SkyApm.Service.RegisterService : Loaded instrument service [Skyxxx] 2023-07-27 10:04:08.477 +08:00 [skywalking-net-demo] [Information] SkyApm.Service.LogReportService : Loaded instrument service [Skxxx] 2023-07-27 10:04:08.477 +08:00 [skywalking-net-demo] [Information] SkyApm.Service.PingService : Loaded instrument service [SkyApm.xxx] 2023-07-27 10:04:08.477 +08:00 [skywalking-net-demo] [Information] SkyApm.Service.SegmentReportService : Loaded instrument servicexxx 2023-07-27 10:04:08.477 +08:00 [skywalking-net-demo] [Information] SkyApm.Service.CLRStatsService : Loaded instrument service [Skyxxx] 2023-07-27 10:04:08.477 +08:00 [skywalking-net-demo] [Information] SkyApm.Sampling.SimpleCountSamplingInterceptor : Loaded instruxxx 2023-07-27 10:04:08.477 +08:00 [skywalking-net-demo] [Information] SkyApm.Transport.Grpc.ConnectService : Loaded instrument servicxxx 2023-07-27 10:04:08.486 +08:00 [skywalking-net-demo] [Information] SkyApm.Transport.Grpc.ConnectionManager : Connected server[tracixxx] 2023-07-27 10:04:08.486 +08:00 [skywalking-net-demo] [Information] SkyApm.Diagnostics.TracingDiagnosticProcessorObserver : Loaded dxxx 2023-07-27 10:04:08.486 +08:00 [skywalking-net-demo] [Information] SkyApm.InstrumentStartup : Started SkyAPM .NET Core Agent. 2023-07-27 10:04:13.512 +08:00 [skywalking-net-demo] [Information] SkyApm.Diagnostics.TracingDiagnosticProcessorObserver : Loaded dxxx 2023-07-27 10:04:13.552 +08:00 [skywalking-net-demo] [Information] SkyApm.Diagnostics.TracingDiagnosticProcessorObserver : Loaded dxxx 2023-07-27 10:04:13.605 +08:00 [skywalking-net-demo] [Information] SkyApm.Service.RegisterService : Reported Service Instance Propexxx 2023-07-27 10:04:20.525 +08:00 [skywalking-net-demo] [Information] SkyApm.Transport.Grpc.V8.SegmentReporter : Report 14 trace segmexxx 2023-07-27 10:04:20.534 +08:00 [skywalking-net-demo] [Error] SkyApm.Transport.Grpc.SegmentReporter : Report trace segment fail. Grpc.Core.RpcException: Status(StatusCode="Unimplemented", Detail="Method not found: skywalking.v3.LogReportService/collect") at SkyApm.Transport.Grpc.LoggerReporter.ReportAsync(IReadOnlyCollection`1 loggerRequests, CancellationToken cancellationToken)
References
To build the agent from source code, run the following commands.
# Download the source code
git clone https://github.com/SkyAPM/SkyAPM-dotnet.git
# Enter the root directory
cd SkyAPM-dotnet/
# Switch to the target tag
git checkout [tagname]
git submodule init
git submodule update
dotnet restore
dotnet build src/SkyApm.Transport.Grpc.Protocol
dotnet build skyapm-dotnet.sln
FAQ
An error can occur when running the dotnet skyapm config command if the required .NET framework version is not installed.
dotnet skyapm config net-app 192.168.0.1:11800
You must install or update .NET to run this application.
App: /Users/whlongxi/.dotnet/tools/dotnet-skyapm
Architecture: arm64
Framework: 'Microsoft.NETCore.App', version '6.0.0' (arm64)
.NET location: /usr/local/share/dotnet
The following frameworks were found:
  7.0.9 at [/usr/local/share/dotnet/shared/Microsoft.NETCore.App]
Learn about framework resolution:
https://aka.ms/dotnet/app-launch-failed
To install missing framework, download:
https://aka.ms/dotnet-core-applaunch?framework=Microsoft.NETCore.App&framework_version=6.0.0&arch=arm64&rid=osx.13-arm64-
Solution 1 (Recommended): The
dotnet-skyapmtool only generates theskyapm.jsonconfiguration file. You can create and configure this file manually as described above. -
Solution 2: Use .NET 6.0.