When multiple applications report observability data to Managed Service for OpenTelemetry in the same region, you need a single place to control data ingestion, metric generation, and retention. The Cluster Configurations tab provides these region-wide controls, so you don't have to configure each application individually.
All settings on this tab apply to every application in the selected region.
Control data collection
The Capture Data parameter determines whether Managed Service for OpenTelemetry accepts data from applications in the current region.
| Setting | Behavior |
|---|---|
| Enable All | Accept data from all applications in the region. |
| Disable All | Reject data from all applications in the region. Data collection billing stops. |
| Enable by Default | Respect each application's own setting. Applications without an explicit setting have data collection enabled. |
| Disable by Default | Respect each application's own setting. Applications without an explicit setting have data collection disabled. |
Enable by Default and Disable by Default give you application-level control. Set either option at the cluster level, then override it for specific applications through their individual data collection settings.

Configure trace-based metric aggregation
By default, Managed Service for OpenTelemetry generates service-level metrics from incoming trace data. These aggregated metrics power:
Dashboards
Alerting rules
Custom metric queries
To collect only raw traces without generating metrics from them, disable this feature.
Set the Metrics Aggregation by Traces parameter:
| Setting | Behavior | Impact |
|---|---|---|
| Enable | Generate service metrics from trace data. | Only traces reported *after* you enable this setting are used for aggregation. Historical trace data is not retroactively processed. |
| Disable | Stop generating service metrics from traces. | Dashboards and alert panels that depend on aggregated metrics become unavailable. Trace data remains intact and queryable through trace analysis. |

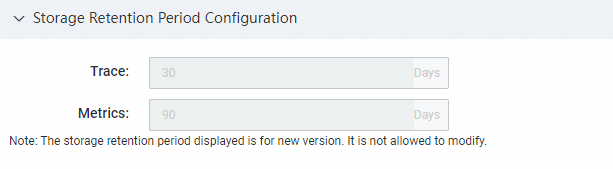
Storage duration
Managed Service for OpenTelemetry retains data for fixed periods based on data type. These retention periods are not configurable.
| Data type | Retention period |
|---|---|
| Traces | 30 days |
| Metrics | 90 days |
Billing is based on the volume of observable data written, not on storage duration.