After you instrument your application with Zipkin and report traces to Managed Service for OpenTelemetry, Managed Service for OpenTelemetry starts monitoring the application, and you can view monitoring data such as application topology, traces, abnormal transactions, slow transactions, and SQL analysis. This topic describes how to perform manual and automatic instrumentation using plugins.
We recommend that you connect your application to Managed Service for OpenTelemetry by using OpenTelemetry Protocol (OTLP). In this case, you are provided with more features, more advanced tracing capabilities, and the best user experience.
Alibaba Cloud provides detailed instructions on how to integrate OpenTelemetry with an application and the best practices of using OpenTelemetry to help you quickly get started with Managed Service for OpenTelemetry. For more information, see Preparations.
Prerequisites
-
Log on to the ARMS console. In the left-side navigation pane, click Integration Center.
-
On the Integration Center page, click the Zipkin card in the Server-side Applications section.
-
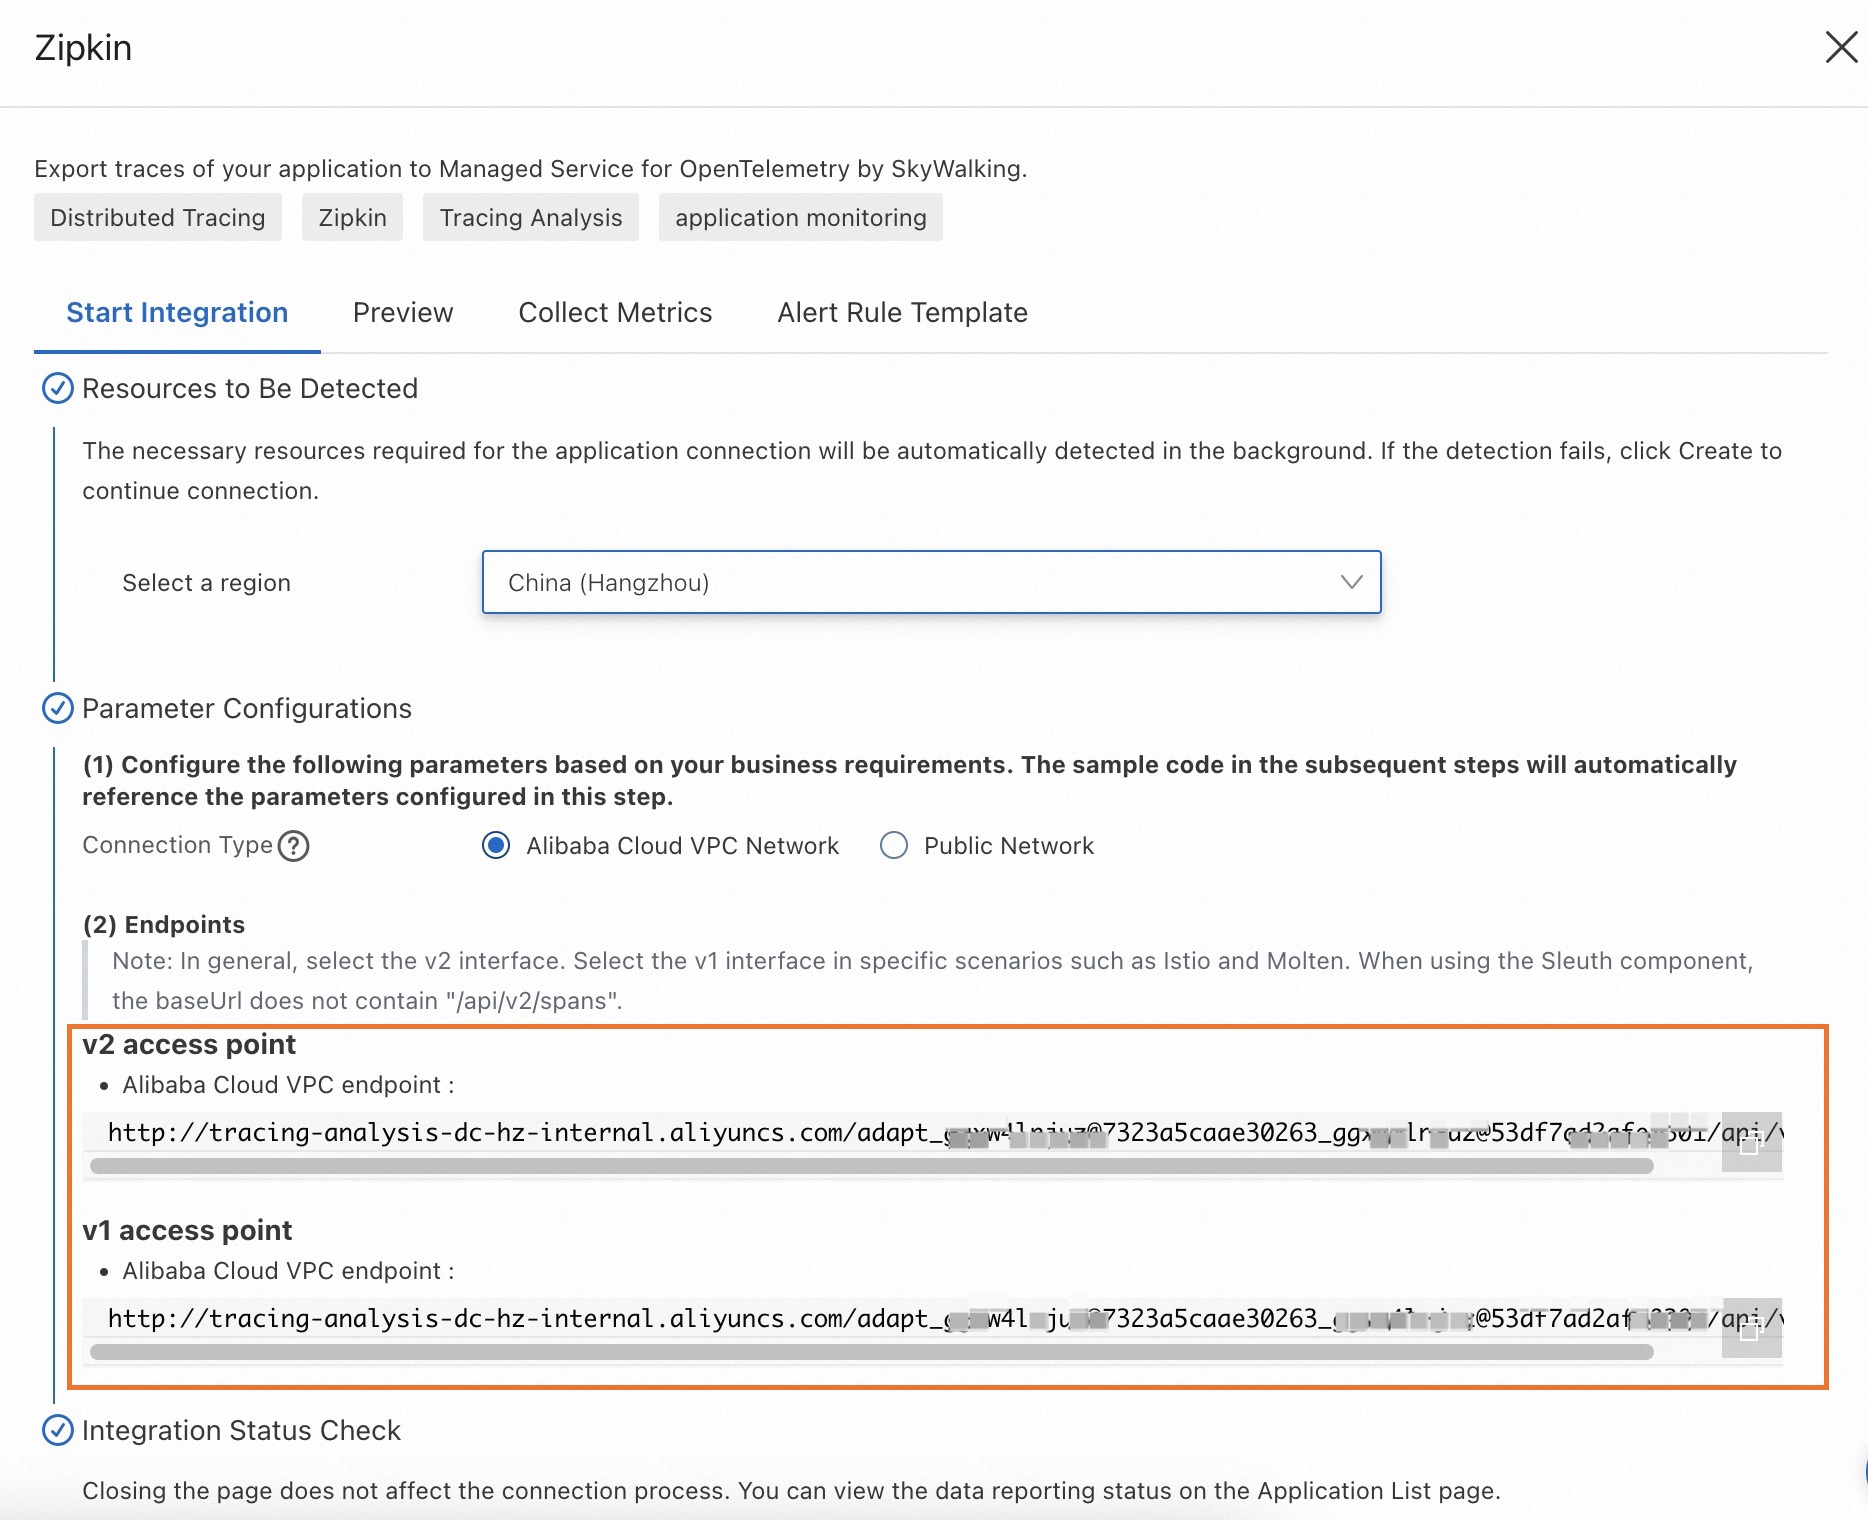
In the Zipkin panel, click the Start Integration tab, and then select a region in which you want to report data.
NoteWhen you access a region for the first time, resources are automatically initialized there.
-
Configure the Connection Type parameter and copy an endpoint.
Note-
If your service is deployed on Alibaba Cloud and resides in the region that you selected, we recommend that you set this parameter to Alibaba Cloud VPC Network. Otherwise, set this parameter to Public Network.
-
In most cases, we recommend that you use a V2 endpoint. If you are familiar with Zipkin, we recommend that you use a V1 endpoint.
-
Background information
Zipkin is an open source distributed real-time data tracking system developed by Twitter. Its main function is to aggregate real-time monitoring data from various heterogeneous systems.
Zipkin provides comprehensive support for various frameworks, such as the following. For a complete list, see the official Zipkin documentation.
Apache HttpClient
Dubbo
gRPC
JAX-RS 2.X
Jersey Server
JMS (Java Message Service)
Kafka
MySQL
Netty
OkHttp
Servlet
Spark
Spring Boot
Spring MVC
To report Java application data to the Managed Service for OpenTelemetry console using Zipkin, you must instrument your application. You can perform manual instrumentation or use plugins for automatic instrumentation.

Manual instrumentation
If you choose manual instrumentation, you must write the code yourself.
To obtain the demo, click to download the source code. Go to the manualDemo directory and run the program by following the instructions in the README file.
Add the dependency JAR packages.
<dependency>
            <groupId>io.zipkin.brave</groupId>
            <artifactId>brave</artifactId>
            <version>5.4.2</version>
        </dependency>
        <dependency>
            <groupId>io.zipkin.reporter2</groupId>
            <artifactId>zipkin-sender-okhttp3</artifactId>
            <version>2.7.9</version>
        </dependency>
Create a tracer.
private static final String zipkinEndPoint = "<endpoint>";
  ...
  // Build the data sender object.
  OkHttpSender sender = OkHttpSender.newBuilder().endpoint(zipkinEndPoint).build();

  // Build the data reporter object.
  Reporter<Span> reporter = AsyncReporter.builder(sender).build();

  tracing = Tracing.newBuilder().localServiceName(localServiceName).spanReporter(reporter).build();
Create a parent span and a child span.
private void firstBiz() {
        // Create a root span.
        tracing.tracer().startScopedSpan("parentSpan");
        Span span =  tracing.tracer().currentSpan();
        span.tag("key", "firstBiz");
        secondBiz();
        span.finish();
    }

    private void secondBiz() {
        tracing.tracer().startScopedSpanWithParent("childSpan", tracing.tracer().currentSpan().context());
        Span childSpan =  tracing.tracer().currentSpan();
        childSpan.tag("key", "secondBiz");
        childSpan.finish();
        System.out.println("end tracing,id:" + childSpan.context().traceIdString());
    }
(Optional) To quickly troubleshoot issues, you can add custom tags to a record, such as whether an error occurred or the return value of a request.
tracer.activeSpan().setTag("http.status_code", "500");When you send an RPC request in a distributed system, the request carries tracing data, including TraceId, ParentSpanId, SpanId, and Sampled. You can use the Inject and Extract methods to pass this data in HTTP request headers. The overall process is as follows:
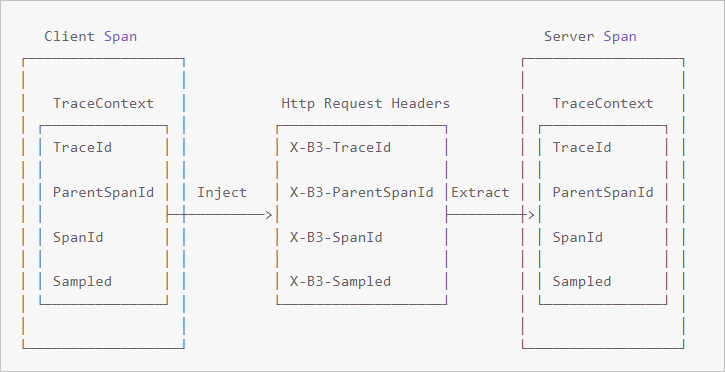
On the client, call the Inject method to pass the context information.
// start a new span representing a client request
    oneWaySend = tracer.nextSpan().name(service + "/" + method).kind(CLIENT);
    --snip--

    // Add the trace context to the request, so it can be propagated in-band
    tracing.propagation().injector(Request::addHeader)
                     .inject(oneWaySend.context(), request);

   // fire off the request asynchronously, totally dropping any response
   request.execute();

   // start the client side and flush instead of finish
   oneWaySend.start().flush();
On the server, call the Extract method to parse the context information.
// pull the context out of the incoming request
extractor = tracing.propagation().extractor(Request::getHeader);

// convert that context to a span which you can name and add tags to
oneWayReceive = nextSpan(tracer, extractor.extract(request))
    .name("process-request")
    .kind(SERVER)
    ... add tags etc.

// start the server side and flush instead of finish
oneWayReceive.start().flush();

// you should not modify this span anymore as it is complete. However,
// you can create children to represent follow-up work.
next = tracer.newSpan(oneWayReceive.context()).name("step2").start();
Instrument using the Spring 2.5 MVC or Spring 3.0 MVC plugin
You can instrument your application using the Spring 2.5 MVC or Spring 3.0 MVC plugin.
To obtain the demo, download the source code. Go to the springMvcDemo\webmvc3|webmvc25 directory and run the program by following the instructions in the Readme file.
Configure the Tracing object in applicationContext.xml.
<bean class="zipkin2.reporter.beans.OkHttpSenderFactoryBean">
  <property name="endpoint" value="<endpoint>"/>
</bean>

<!-- allows us to read the service name from spring config -->
<context:property-placeholder/>

<bean class="brave.spring.beans.TracingFactoryBean">
  <property name="localServiceName" value="brave-webmvc3-example"/>
  <property name="spanReporter">
    <bean class="zipkin2.reporter.beans.AsyncReporterFactoryBean">
      <property name="encoder" value="JSON_V2"/>
      <property name="sender" ref="sender"/>
      <!-- wait up to half a second for any in-flight spans on close -->
      <property name="closeTimeout" value="500"/>
    </bean>
  </property>
  <property name="propagationFactory">
    <bean class="brave.propagation.ExtraFieldPropagation" factory-method="newFactory">
      <constructor-arg index="0">
        <util:constant static-field="brave.propagation.B3Propagation.FACTORY"/>
      </constructor-arg>
      <constructor-arg index="1">
        <list>
          <value>user-name</value>
        </list>
      </constructor-arg>
    </bean>
  </property>
  <property name="currentTraceContext">
    <bean class="brave.spring.beans.CurrentTraceContextFactoryBean">
      <property name="scopeDecorators">
        <bean class="brave.context.log4j12.MDCScopeDecorator" factory-method="create"/>
      </property>
    </bean>
  </property>
</bean>

<bean class="brave.spring.beans.HttpTracingFactoryBean">
  <property name="tracing" ref="tracing"/>
</bean>
Add the Interceptors object.
<bean class="brave.httpclient.TracingHttpClientBuilder"
      factory-method="create">
    <constructor-arg type="brave.http.HttpTracing" ref="httpTracing"/>
  </bean>

  <bean factory-bean="httpClientBuilder" factory-method="build"/>

  <bean class="org.springframework.web.servlet.mvc.annotation.DefaultAnnotationHandlerMapping">
    <property name="interceptors">
      <list>
        <bean class="brave.spring.webmvc.SpanCustomizingHandlerInterceptor"/>
      </list>
    </property>
  </bean>

  <!-- Loads the controller -->
  <context:component-scan base-package="brave.webmvc"/>
Add the Filter object.
<!-- Add the delegate to the standard tracing filter and map it to all paths -->
<filter>
  <filter-name>tracingFilter</filter-name>
  <filter-class>brave.spring.webmvc.DelegatingTracingFilter</filter-class>
</filter>
<filter-mapping>
  <filter-name>tracingFilter</filter-name>
  <url-pattern>/*</url-pattern>
</filter-mapping>
Instrument using the Spring 4.0 MVC or Spring Boot plugin
You can instrument your application with the Spring 4.0 MVC or Spring Boot plugin.
To obtain the demo, download the source code. Go to the springMvcDemo\webmvc4-boot|webmv4 directory and run the program by following the instructions in the Readme file.
Configure Tracing and Filter.
/** Configuration for how to send spans to Zipkin */
  @Bean Sender sender() {
    return OkHttpSender.create("<endpoint>");
  }

  /** Configuration for how to buffer spans into messages for Zipkin */
  @Bean AsyncReporter<Span> spanReporter() {
    return AsyncReporter.create(sender());
  }

  /** Controls aspects of tracing such as the name that shows up in the UI */
  @Bean Tracing tracing(@Value("${spring.application.name}") String serviceName) {
    return Tracing.newBuilder()
        .localServiceName(serviceName)
        .propagationFactory(ExtraFieldPropagation.newFactory(B3Propagation.FACTORY, "user-name"))
        .currentTraceContext(ThreadLocalCurrentTraceContext.newBuilder()
            .addScopeDecorator(MDCScopeDecorator.create()) // puts trace IDs into logs
            .build()
        )
        .spanReporter(spanReporter()).build();
  }

  /** decides how to name and tag spans. By default they are named the same as the http method. */
  @Bean HttpTracing httpTracing(Tracing tracing) {
    return HttpTracing.create(tracing);
  }

  /** Creates client spans for http requests */
  // We are using a BPP as the Frontend supplies a RestTemplate bean prior to this configuration
  @Bean BeanPostProcessor connectionFactoryDecorator(final BeanFactory beanFactory) {
    return new BeanPostProcessor() {
      @Override public Object postProcessBeforeInitialization(Object bean, String beanName) {
        return bean;
      }

      @Override public Object postProcessAfterInitialization(Object bean, String beanName) {
        if (!(bean instanceof RestTemplate)) return bean;

        RestTemplate restTemplate = (RestTemplate) bean;
        List<ClientHttpRequestInterceptor> interceptors =
            new ArrayList<>(restTemplate.getInterceptors());
        interceptors.add(0, getTracingInterceptor());
        restTemplate.setInterceptors(interceptors);
        return bean;
      }

      // Lazy lookup so that the BPP doesn't end up needing to proxy anything.
      ClientHttpRequestInterceptor getTracingInterceptor() {
        return TracingClientHttpRequestInterceptor.create(beanFactory.getBean(HttpTracing.class));
      }
    };
  }

  /** Creates server spans for http requests */
  @Bean Filter tracingFilter(HttpTracing httpTracing) {
    return TracingFilter.create(httpTracing);
  }

  @Autowired SpanCustomizingAsyncHandlerInterceptor webMvcTracingCustomizer;

  /** Decorates server spans with application-defined web tags */
  @Override public void addInterceptors(InterceptorRegistry registry) {
    registry.addInterceptor(webMvcTracingCustomizer);
  }
Configure auto-configuration (spring.factories).
org.springframework.boot.autoconfigure.EnableAutoConfiguration=\
brave.webmvc.TracingConfiguration
Instrument using the Dubbo plugin
You can instrument your application using the Dubbo plugin.
To obtain the demo, click to download the source code. Go to the dubboDemo directory and run the program according to the instructions in the Readme file.
Add the dependency JAR packages.
<dependency>
            <groupId>io.zipkin.brave</groupId>
            <artifactId>brave-instrumentation-dubbo-rpc</artifactId>
            <version>5.4.2</version>
        </dependency>

        <dependency>
            <groupId>io.zipkin.brave</groupId>
            <artifactId>brave-spring-beans</artifactId>
            <version>5.4.2</version>
        </dependency>

        <dependency>
            <groupId>io.zipkin.brave</groupId>
            <artifactId>brave-context-slf4j</artifactId>
            <version>5.4.2</version>
        </dependency>
        <dependency>
            <groupId>io.zipkin.reporter2</groupId>
            <artifactId>zipkin-sender-okhttp3</artifactId>
            <version>2.7.9</version>
        </dependency>
        <dependency>
            <groupId>io.zipkin.brave</groupId>
            <artifactId>brave</artifactId>
            <version>5.4.2</version>
        </dependency>

        <dependency>
            <groupId>io.zipkin.reporter2</groupId>
            <artifactId>zipkin-sender-okhttp3</artifactId>
            <version>2.7.9</version>
        </dependency>
Configure the Tracing object.
<bean class="zipkin2.reporter.beans.OkHttpSenderFactoryBean">
        <property name="endpoint" value="<endpoint>"/>
    </bean>

    <bean class="brave.spring.beans.TracingFactoryBean">
        <property name="localServiceName" value="double-provider"/>
        <property name="spanReporter">
            <bean class="zipkin2.reporter.beans.AsyncReporterFactoryBean">
                <property name="sender" ref="sender"/>
                <!-- wait up to half a second for any in-flight spans on close -->
                <property name="closeTimeout" value="500"/>
            </bean>
        </property>
        <property name="currentTraceContext">
            <bean class="brave.spring.beans.CurrentTraceContextFactoryBean">
                <property name="scopeDecorators">
                    <bean class="brave.context.slf4j.MDCScopeDecorator" factory-method="create"/>
                </property>
            </bean>
        </property>
    </bean>
Add the Filter configuration.
// Server-side configuration.
<dubbo:provider filter="tracing" />
// Client-side configuration.
<dubbo:consumer filter="tracing" />
Instrument using the Spring Sleuth plugin
You can instrument your application using the Spring Sleuth plugin.
To obtain the demo, download the source code. Then, navigate to the sleuthDemo directory and run the program by following the instructions in the README file.
Add the dependency JAR packages.
<dependency>
            <groupId>io.zipkin.brave</groupId>
            <artifactId>brave</artifactId>
            <version>5.4.2</version>
        </dependency>

        <dependency>
            <groupId>io.zipkin.reporter2</groupId>
            <artifactId>zipkin-sender-okhttp3</artifactId>
            <version>2.7.9</version>
        </dependency>
        <dependency>
            <groupId>org.springframework.boot</groupId>
            <artifactId>spring-boot-starter-web</artifactId>
            <version>2.0.1.RELEASE</version>
        </dependency>
        <dependency>
            <groupId>org.springframework.cloud</groupId>
            <artifactId>spring-cloud-sleuth-core</artifactId>
            <version>2.0.1.RELEASE</version>
        </dependency>
        <dependency>
            <groupId>org.springframework.cloud</groupId>
            <artifactId>spring-cloud-sleuth-zipkin</artifactId>
            <version>2.0.1.RELEASE</version>
        </dependency>
Configure application.yml.
NoteReplace
<endpoint_short>with the endpoint that you obtained in the Prerequisites section (the string between "Public Endpoint:" and "api/v2/spans").spring: application: # This ends up as the service name in zipkin name: sleuthDemo zipkin: # Uncomment to send to zipkin, replacing 192.168.99.100 with your zipkin IP address baseUrl: <endpoint_short> sleuth: sampler: probability: 1.0 sample: zipkin: # When enabled=false, traces log to the console. Comment to send to zipkin enabled: trueInitiate an HTTP request, such as
http://localhost:3380/traced.NoteFor more request URIs, see the methods in
com.alibaba.apm.SampleControllerin the demo.
FAQ
Q: The demo program executes successfully, but why is data missing for some websites?
A: Use breakpoint debugging on the parseResponse method in zipkin2.reporter.okhttp3.HttpCall to check the return value of the data report. If a 403 error is returned, the username is incorrectly configured. Check the endpoint configuration.