Quick start: Java GC log analysis
This guide shows you how to use the Java GC log analysis feature in Application Real-Time Monitoring Service (ATP) to identify the cause of response timeouts.
1. Generate and upload a data source
Imagine an application has a strict API response time requirement where any response over one second is considered a timeout. One day, you observe intermittent timeouts on your production APIs and suspect that GC pauses are the cause.
To investigate, find the application's GC log, upload it to ATP, and start the analysis. For specific instructions, see Get started with ATP.
2. Analyze the GC log in ATP
On the analysis results page, first review basic information such as the GC type, number of GC threads, and the log's time range. This step confirms that you uploaded the correct file for your application and helps rule out operational errors.
Next, adjust the Analysis Configuration to select the time frame when the timeouts occurred. Since the application is sensitive to pause times, set the long pause threshold to 200 ms.
Leave the other parameters at their default values: Young GC Interval Threshold (ms) at 1000, Old GC Interval Threshold (ms) at 15000, and Full GC Interval Threshold (ms) at 60000. After configuring the settings, click OK.
Then, check the Problem Diagnosis view. Here, ATP automatically identifies critical issues from the log and provides tuning recommendations. The view shows that a long Final Remark phase occurred around 4:00.
ATP provides the following tuning recommendations: if the Rescan phase is long, add the -XX:+CMSScavengeBeforeRemark JVM parameter; if Reference Processing is slow, enable parallel processing with the -XX:+ParallelRefProcEnabled JVM parameter (enabled by default in JDK 11 and later) or investigate your code for Weak, Soft, and Phantom References; if Class Unloading takes a long time, optimize your code to reduce the number of class loaders.
In the Pause Information view, you can confirm that a Final Remark event caused the longest pause (442 ms). This event is the likely root cause of the timeouts.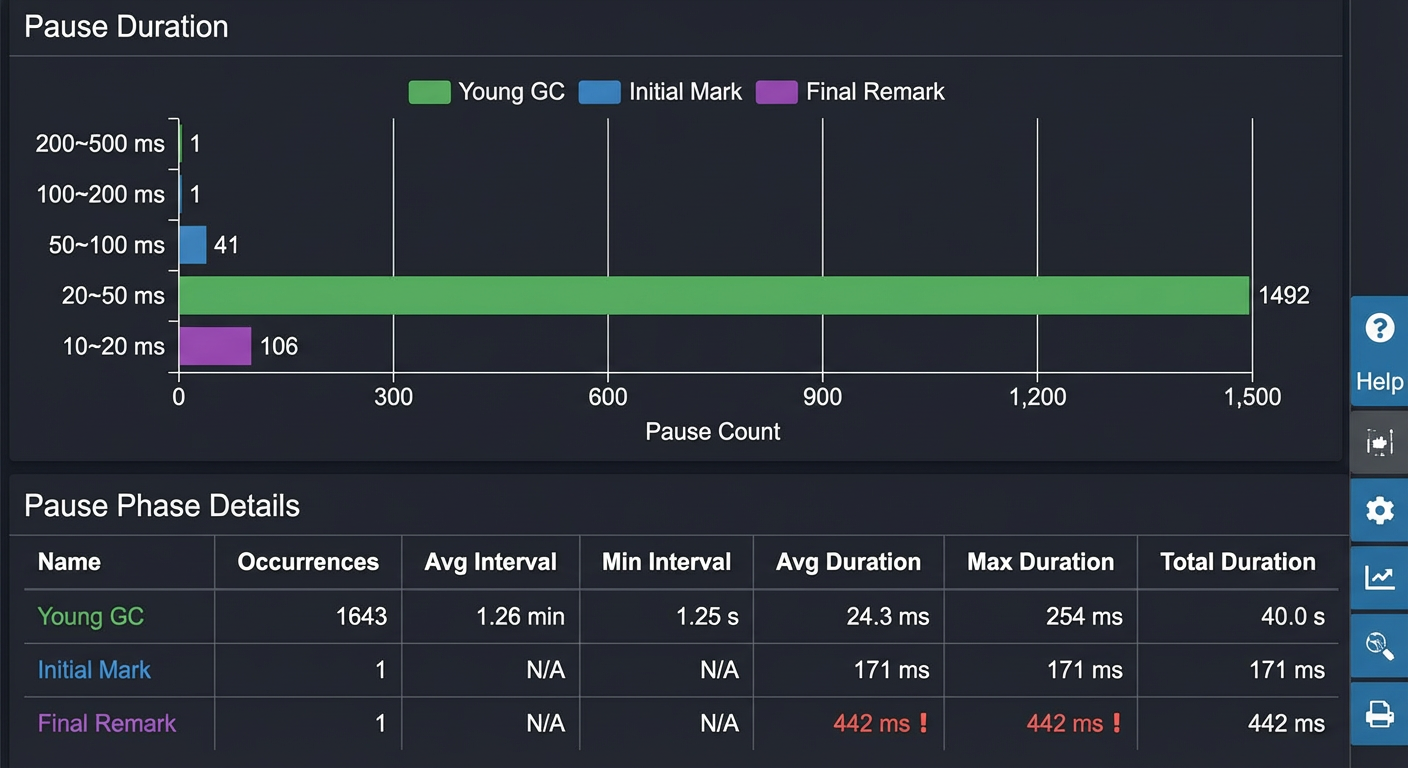
In the Log Details view, you can locate this specific Final Remark event by setting a pause time range in the search filter. The event details show that the Rescan and Class Unloading phases dominated the pause, allowing you to perform targeted optimizations.
Finally, check the Memory Statistics view. You will see that memory utilization is low after each Old GC, and both the object allocation and promotion rates are also low. This suggests that you do not need further heap analysis for memory issues.
3. Conclusion
The analysis shows that the application timeouts are caused by the Concurrent Mark Sweep (CMS) Final Remark pause. To resolve this issue, optimize the pause time by tuning the JVM parameters or upgrading to the G1 garbage collector.