Use the Resource Inspection Feature
The resource inspection feature of Cloud Migration Hub (CMH) analyzes the performance of your target cloud resources during the cutover phase, so you can identify capacity risks before traffic switches over.
Run a resource inspection task before the cutover window to confirm that target resources can handle production workloads. If risks are detected, address them or prepare a rollback plan before proceeding.
Prerequisites
Before you begin, ensure that you have:
Access to the CMH console
A migration plan or a list of target instances to inspect
(Optional) Forward Data Transmission Service (DTS) tasks, if you plan to create reverse DTS tasks during the cutover phase
Create a resource inspection plan
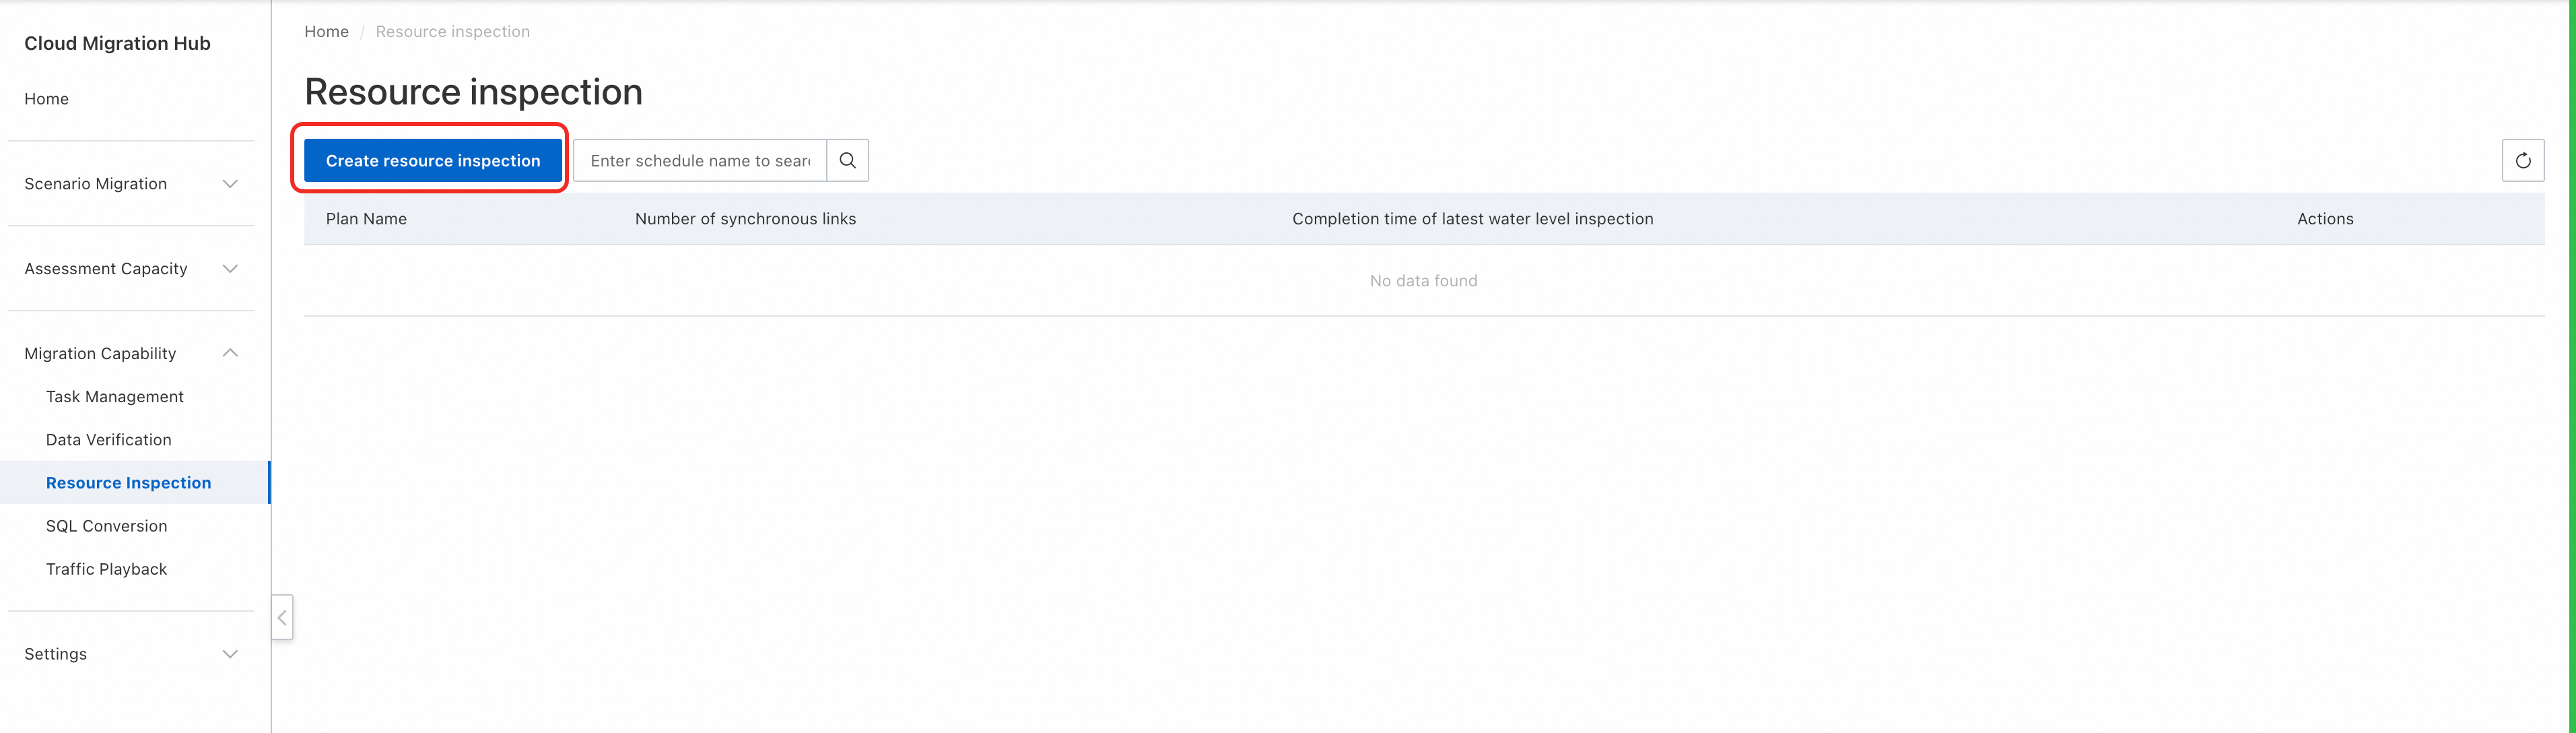
Log on to the CMH console. In the left-side navigation pane, choose Migration capability > Resource inspection.
On the Resource inspection page, click Create resource inspection.
In the Cutover Resource Association step, configure the Plan Name and Remarks parameters. Then configure Associated Resources using one or more of the following methods:
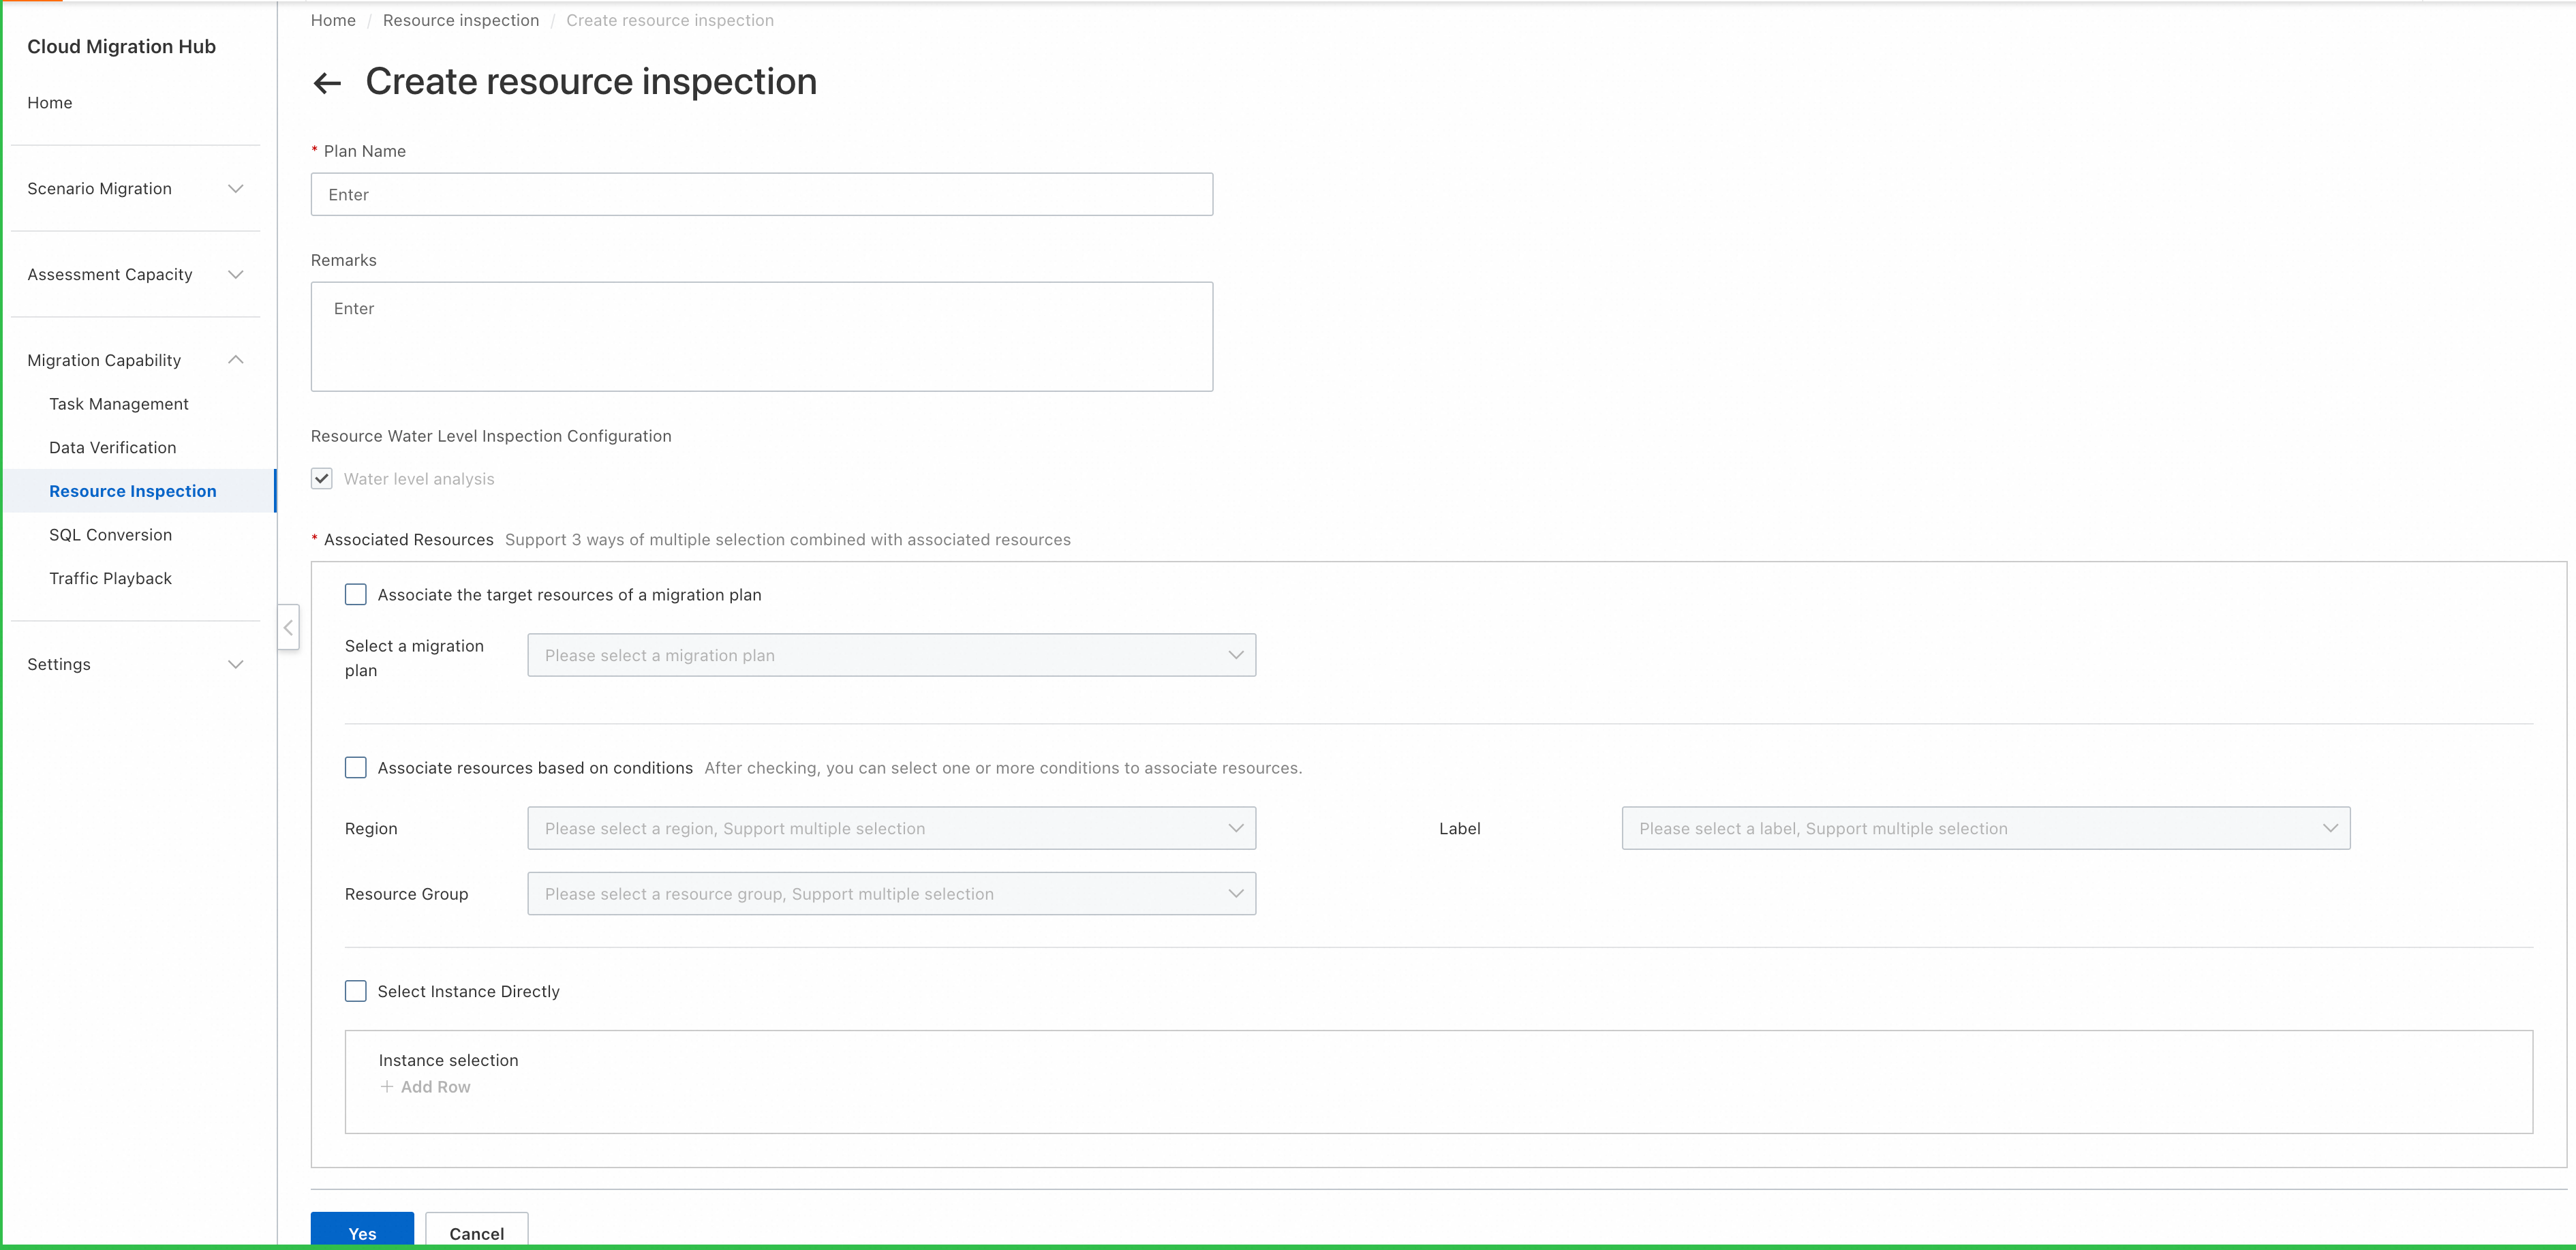
Associate the target resources of a migration plan
Inspects the resources belonging to a migration plan that you created in the CMH console.
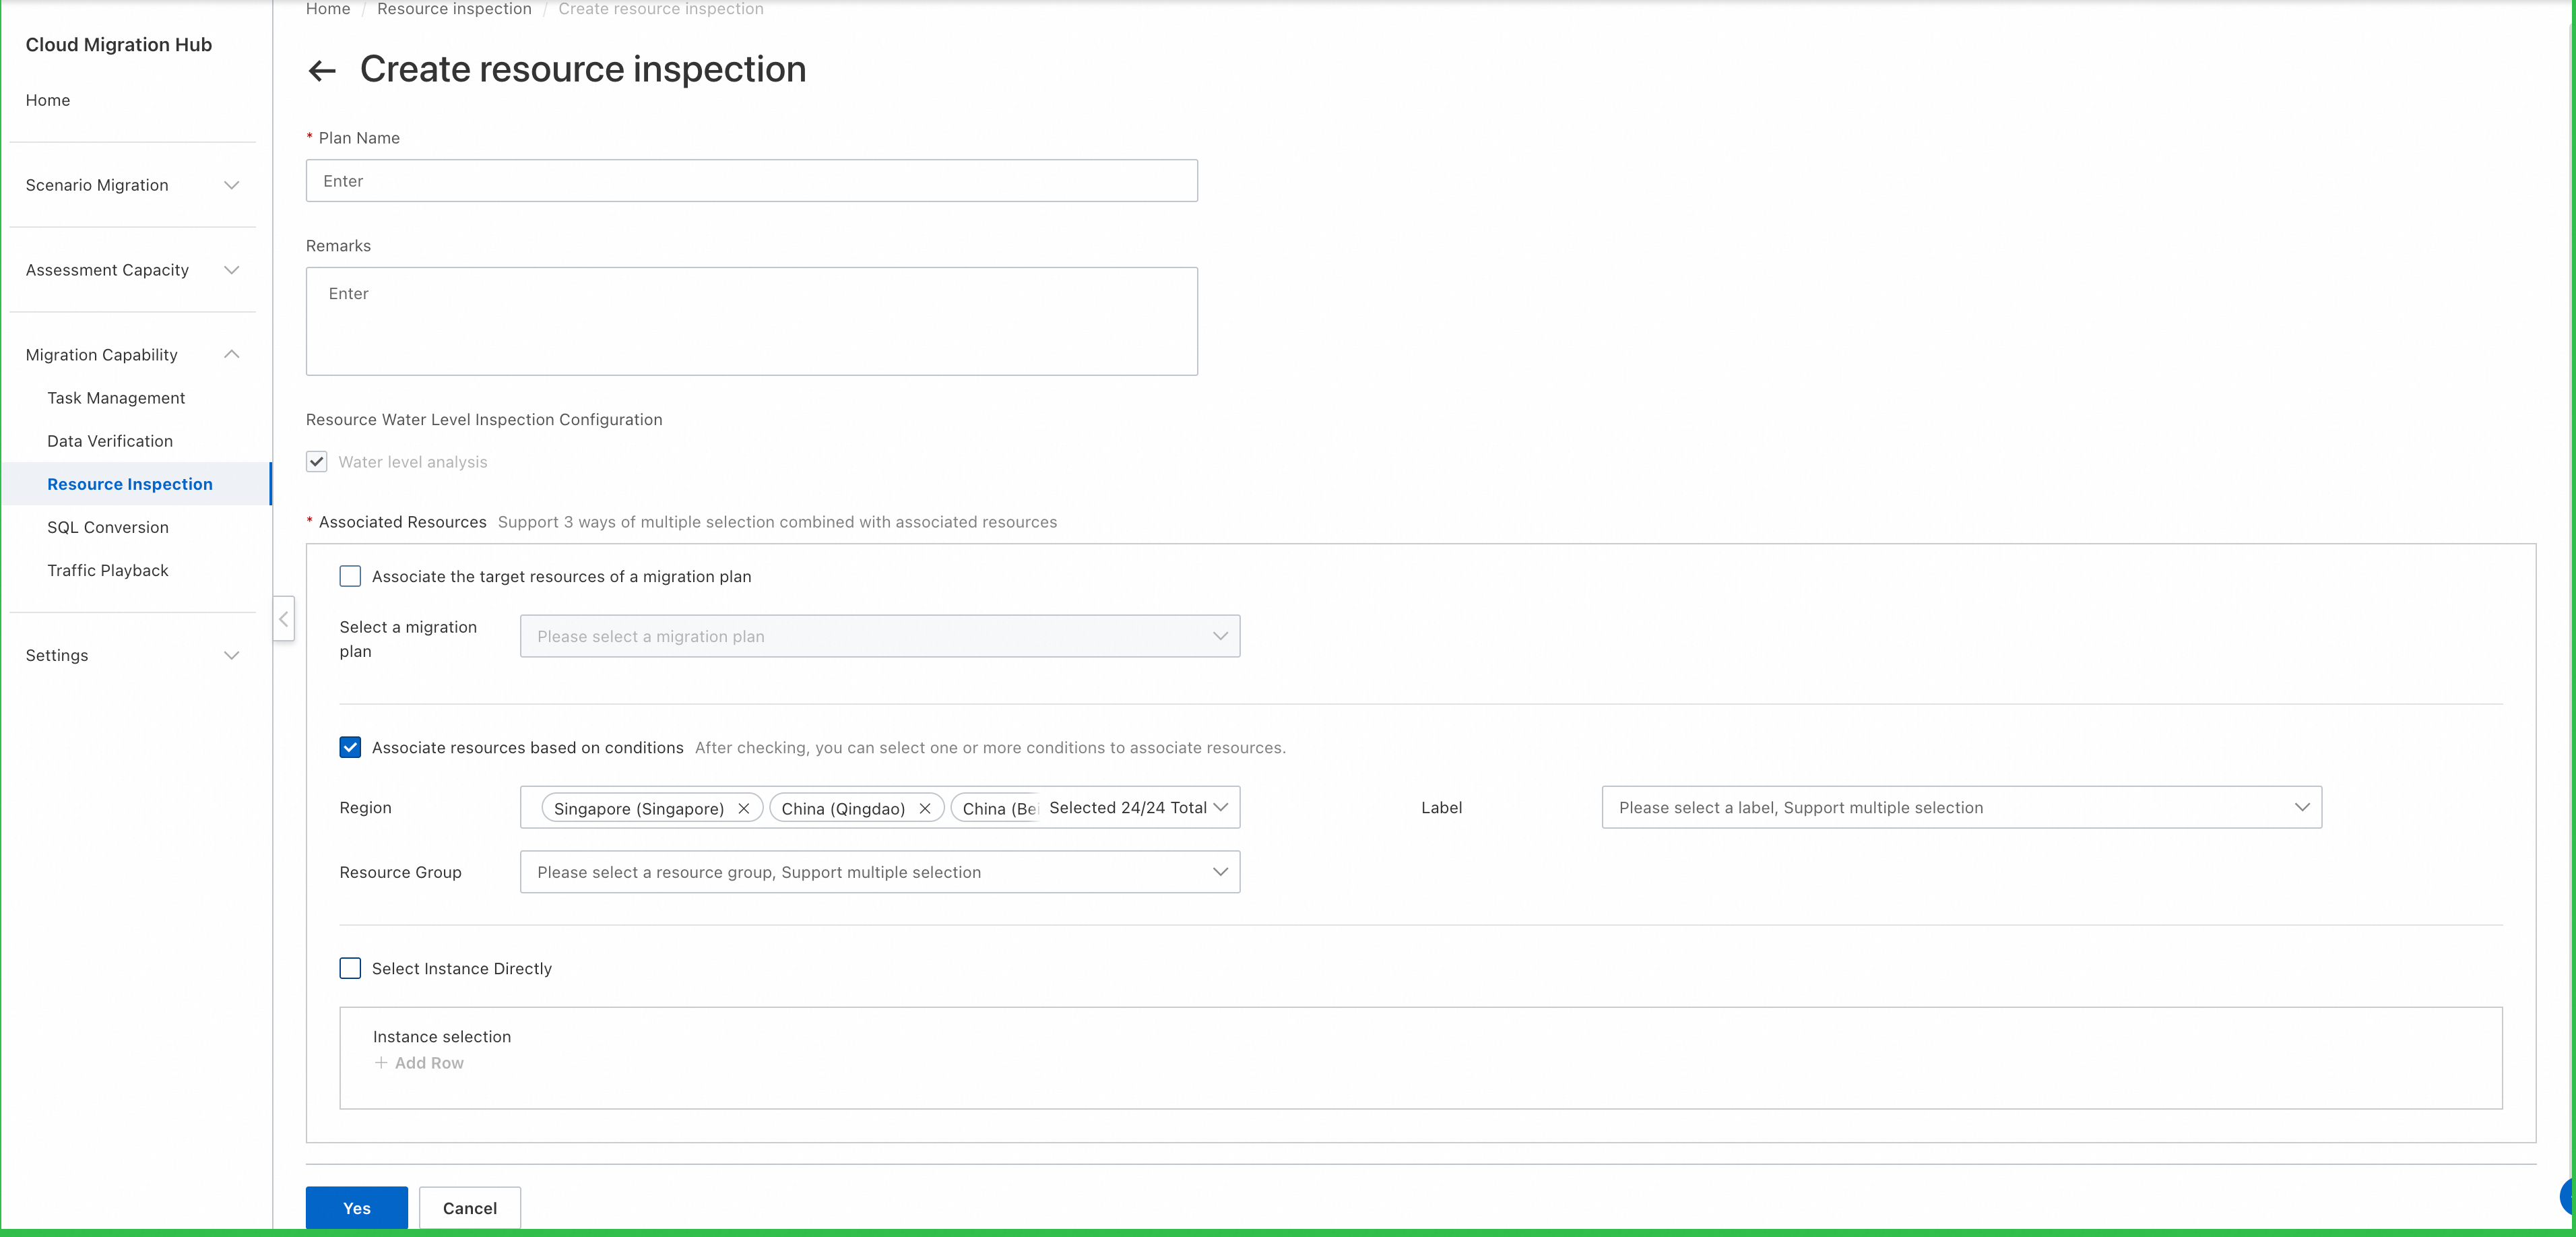
Associate resources based on conditions
Inspects resources in specified regions that have specified tags applied.
Select instance directly
Inspects specific instances that you select.
Note: You can select all three methods at the same time. CMH then inspects all resources that meet the conditions specified by the association methods.
Click Next.
In the Migration Task Association step, select forward DTS tasks. This lets you create multiple reverse DTS tasks at a time during the cutover phase. For more information, see Create reverse DTS tasks.
Note: This step is optional. If you do not need reverse DTS tasks, click Yes to create the plan immediately.
Run a resource inspection task
On the Resource inspection page, click the name of your inspection plan to open its details page.
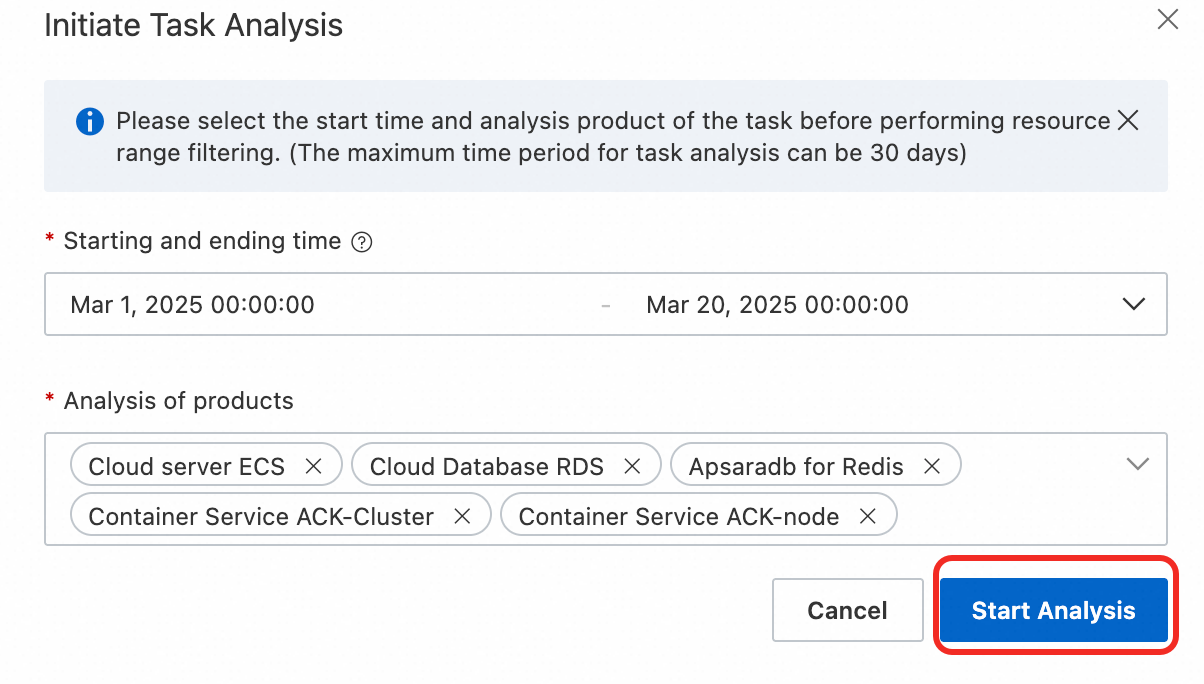
On the Resource water level analysis tab, click Initiate Task Analysis.

In the Initiate Task Analysis panel, set the Starting and ending time and Analysis of products parameters, then click Start Analysis.
Wait for data collection to complete. Task duration varies based on the number of resources being analyzed.

View resource inspection results
The results page has four sections: basic task information, per-service risk flags, metric statistics charts, and an instance load table. Review each section to determine whether the cutover is safe to proceed.
View current and historical records
The Resource water level analysis tab shows the most recent task by default, marked with the Latest tag below the task ID.

To view older tasks, click Historical Analysis Record. All past records are listed in the panel that appears.

View the results of a resource inspection task
Basic information
The upper part of the Resource water level analysis tab shows the task status, analysis time range, resources analyzed, and task start and end times.

Service information
Analysis results are grouped by cloud service on separate tabs. Click a tab to see the results for that service.
If risks are detected for a service, a red number appears next to its tab name, indicating how many resources exceed the threshold. For example, the figure below shows that two Elastic Compute Service (ECS) resources exceed the threshold.

Metric statistics charts
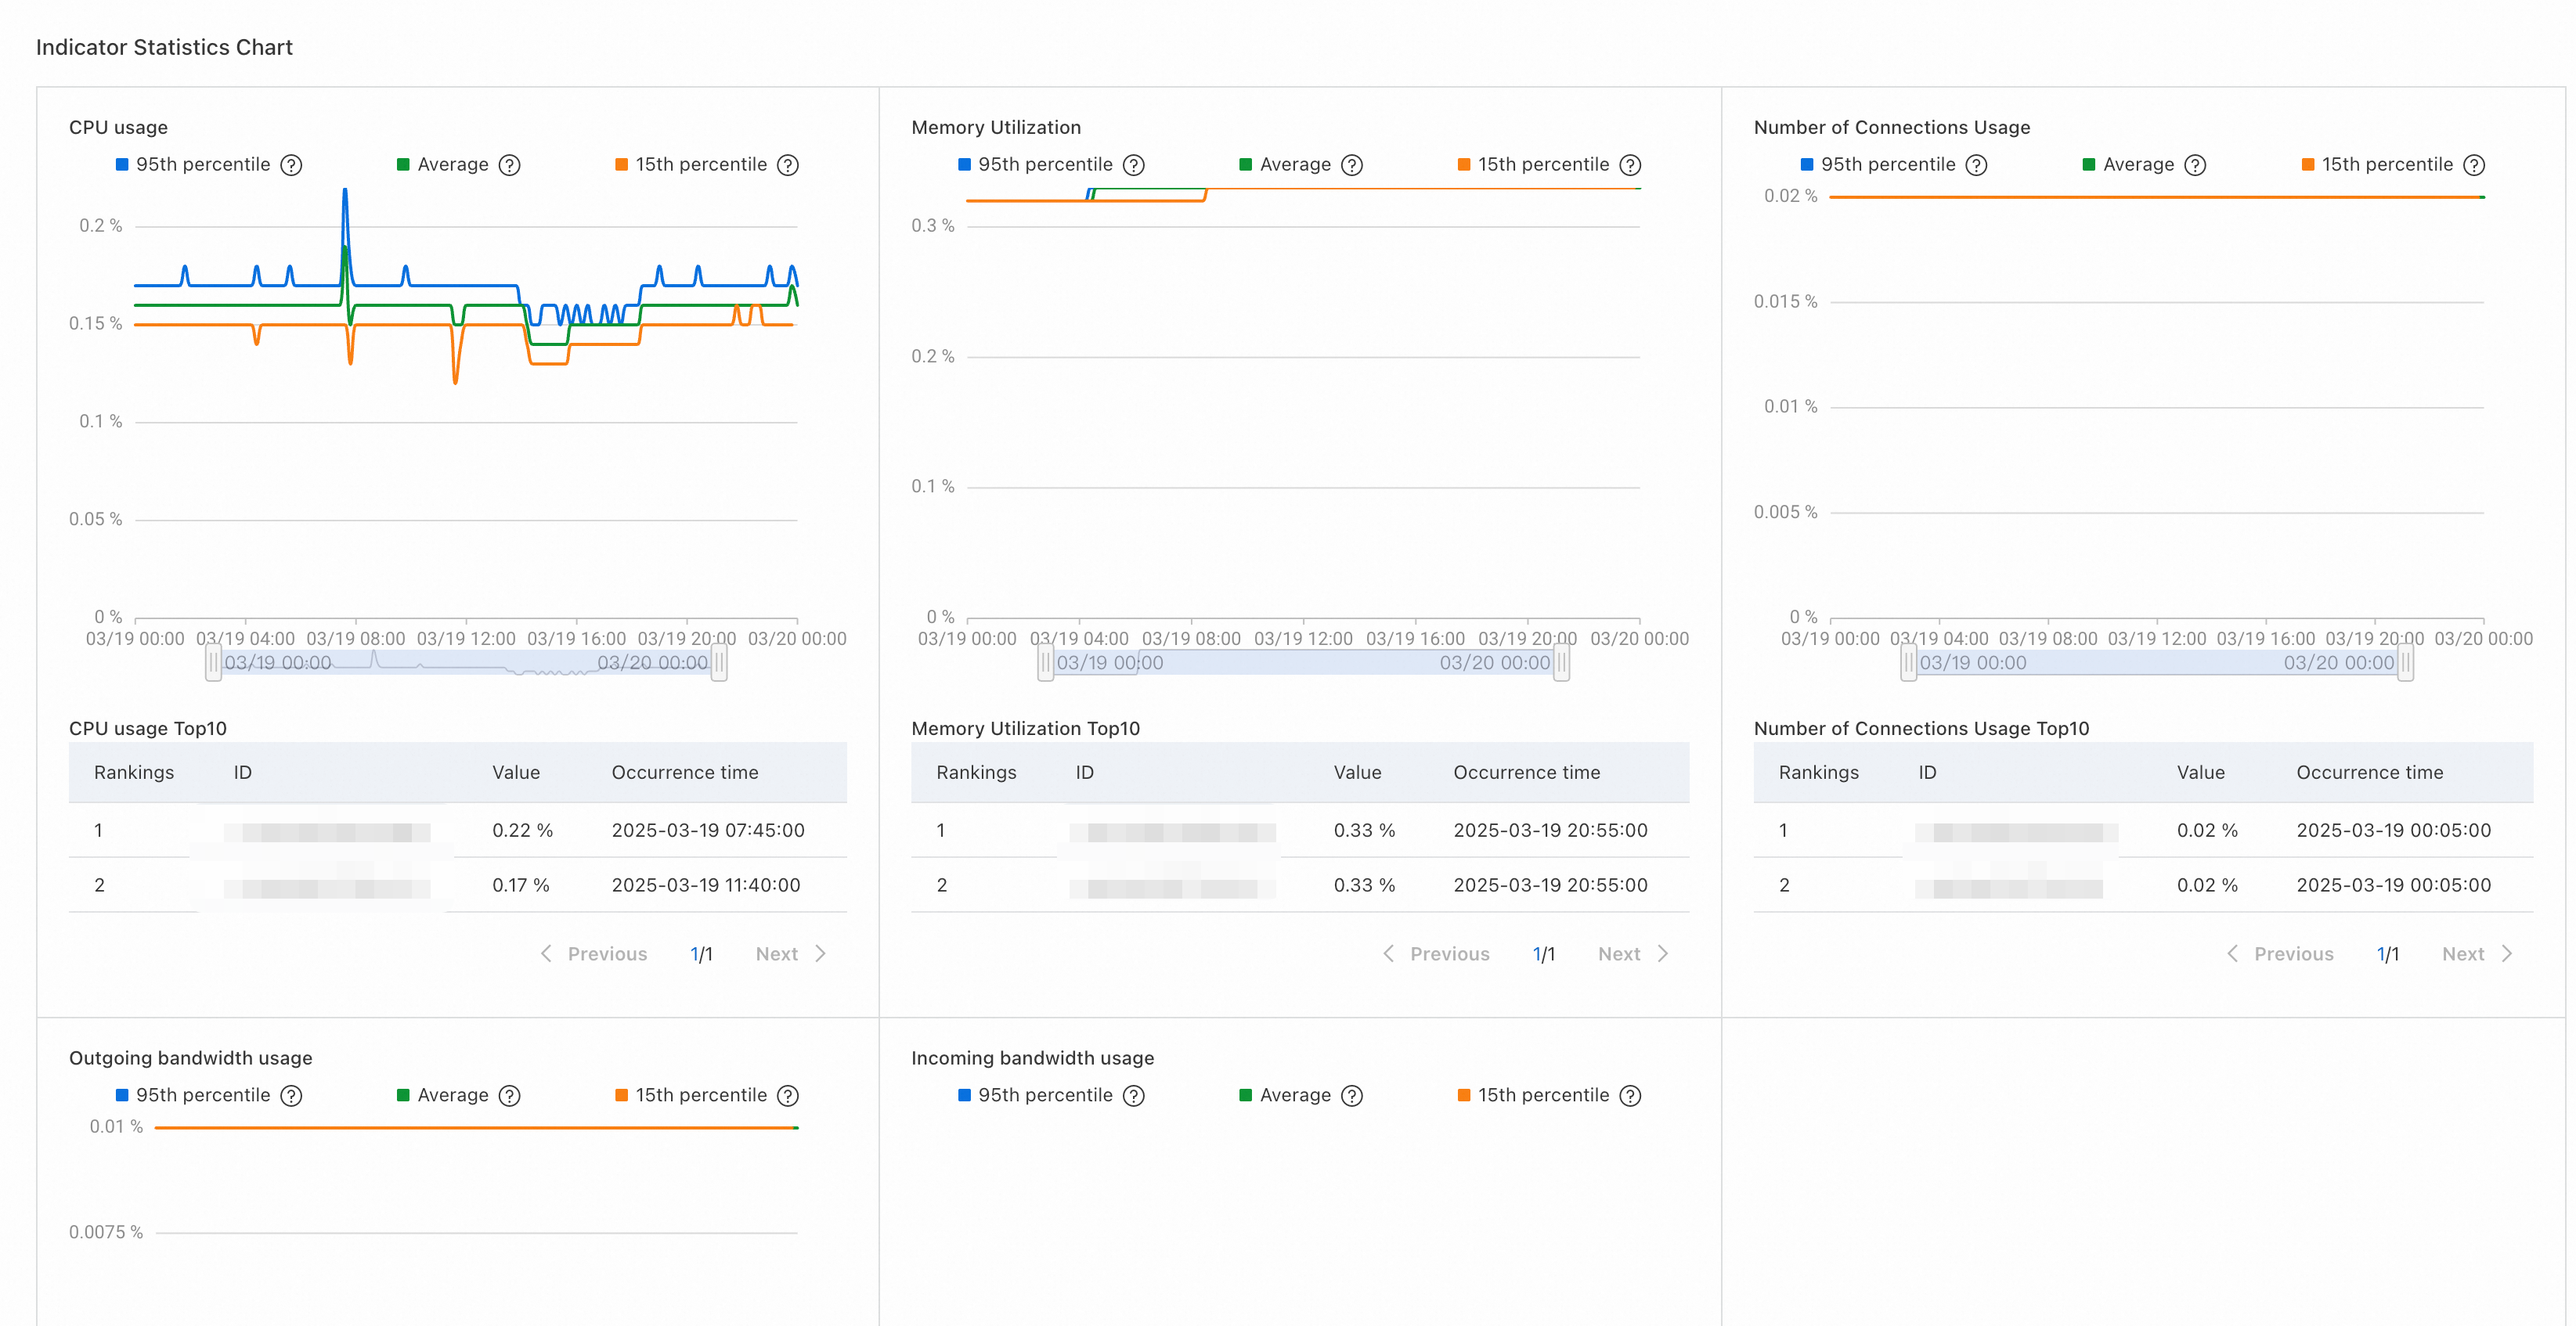
The Indicator Statistics Chart section shows line charts of core metrics for the selected service, along with a ranking of the users consuming the most resources.
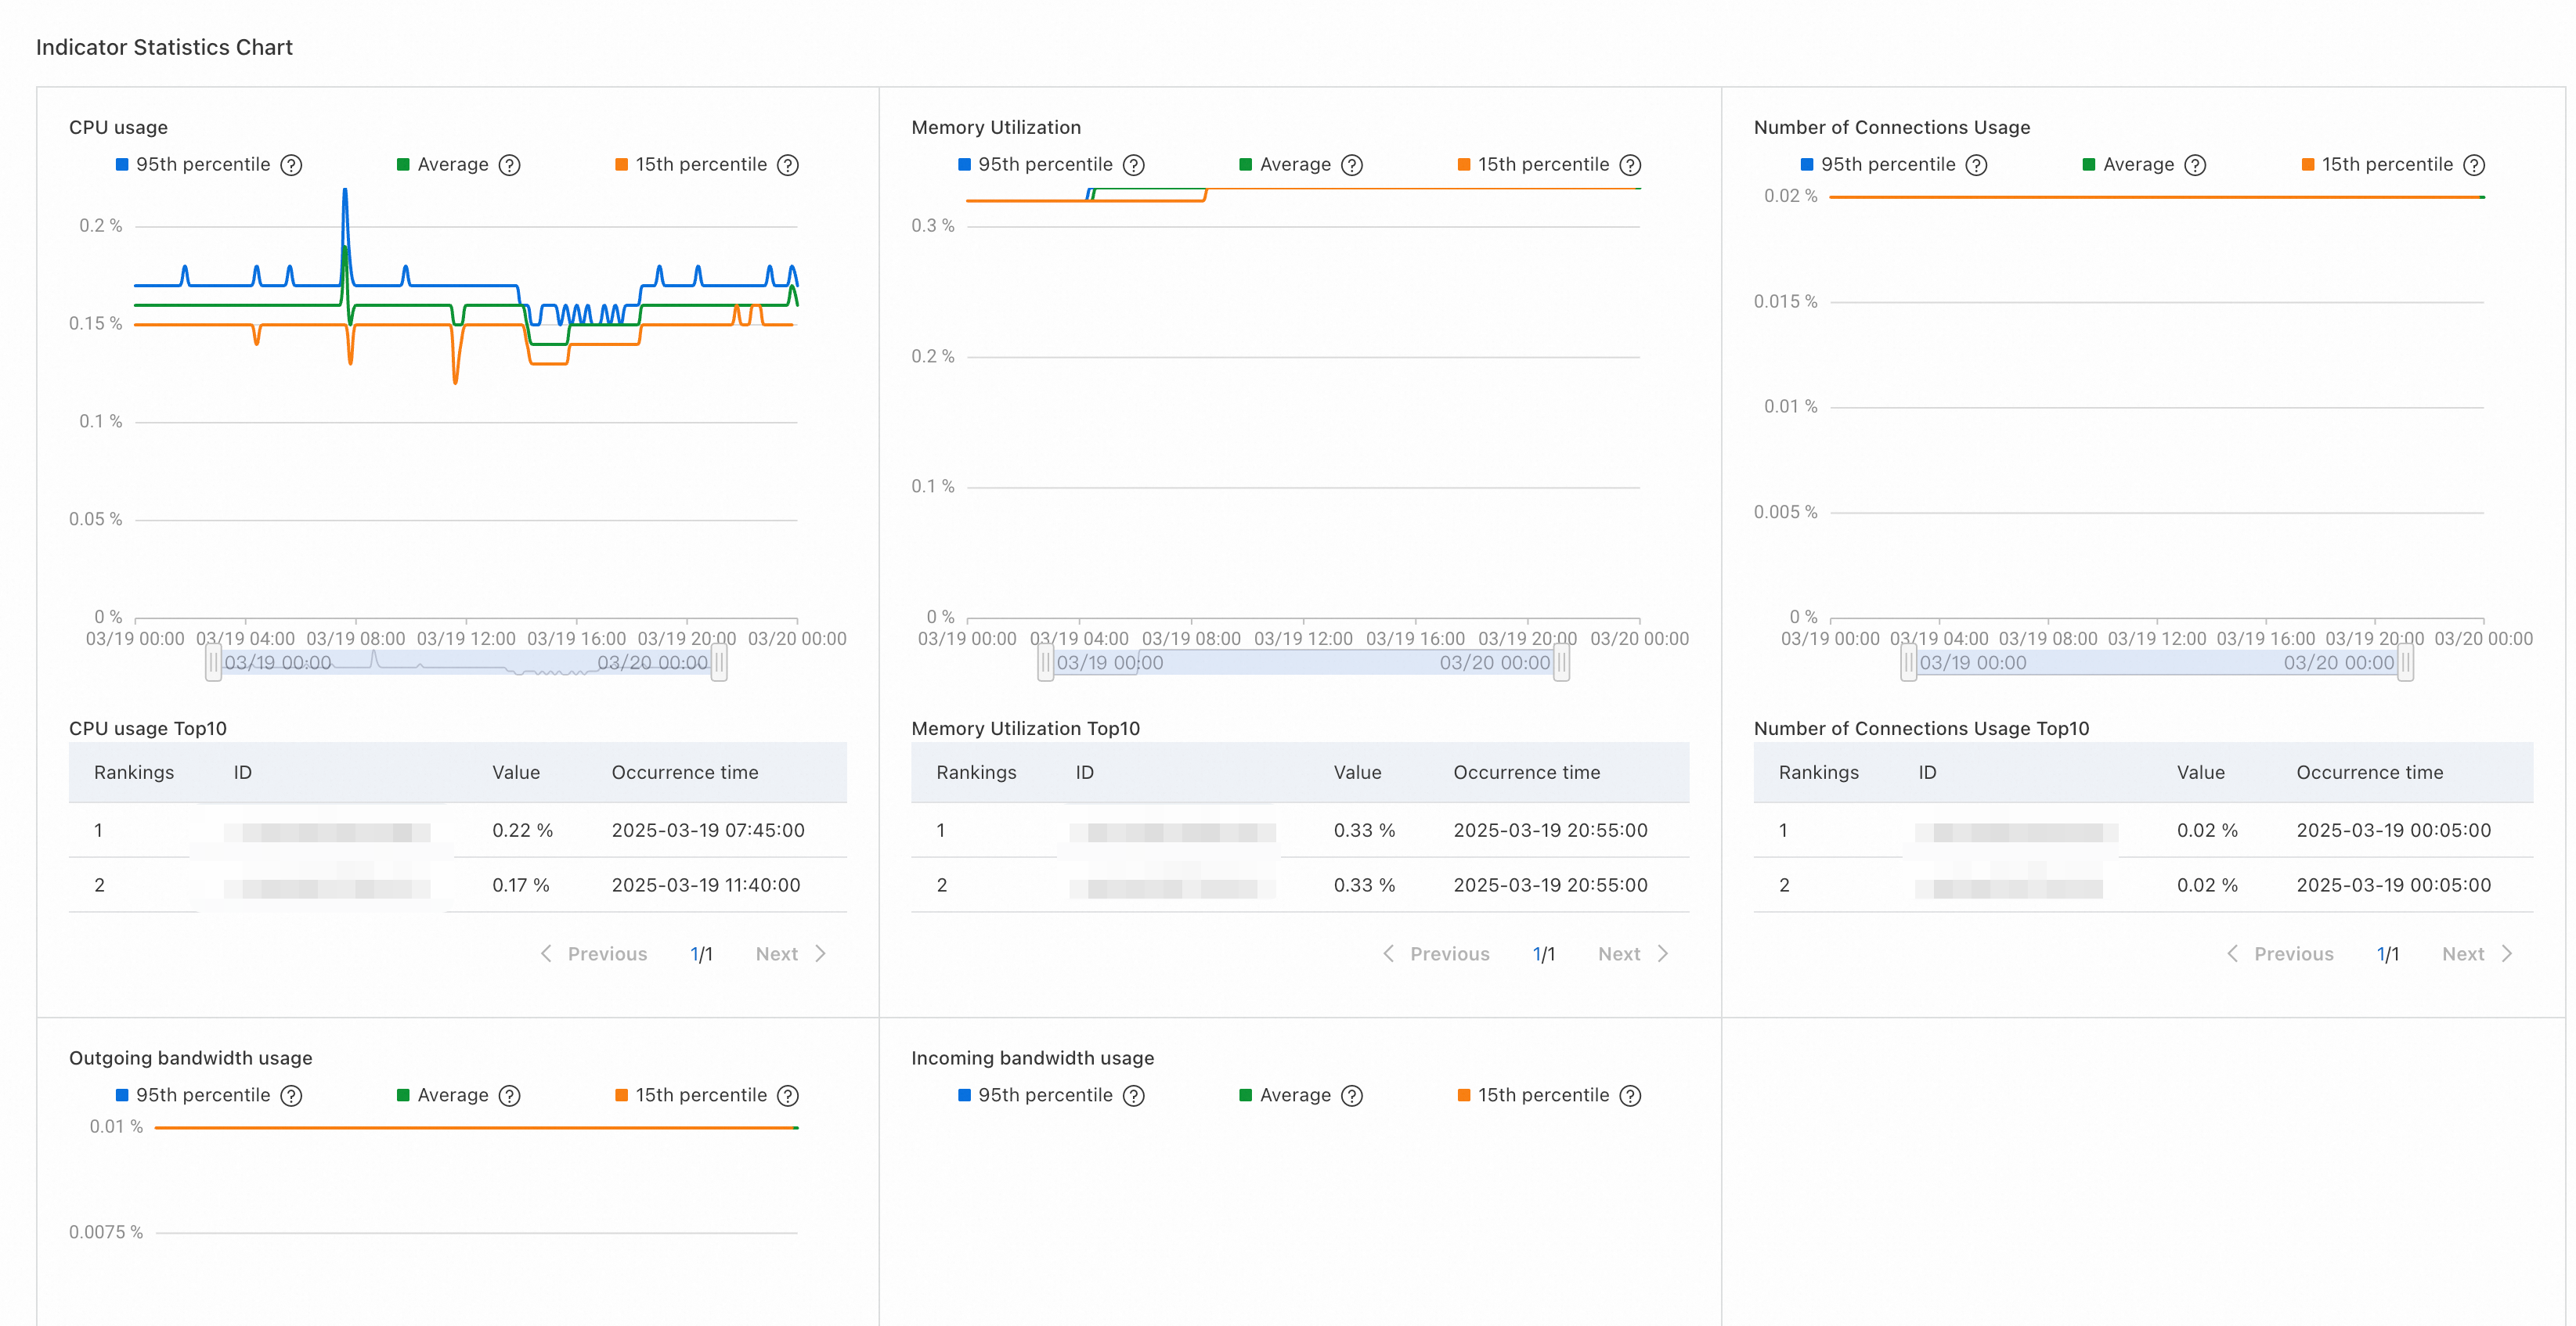
Apply filter conditions to narrow the data. The charts and rankings update automatically to reflect the specified filters.

Each line chart shows load trends over a time period and highlights peak loads. Adjust the timeline below the chart to focus on a specific time range. The chart and rankings update to match.
Instance load statistics
The lower part of each service tab shows instance-level load details, organized by metric on separate tabs.
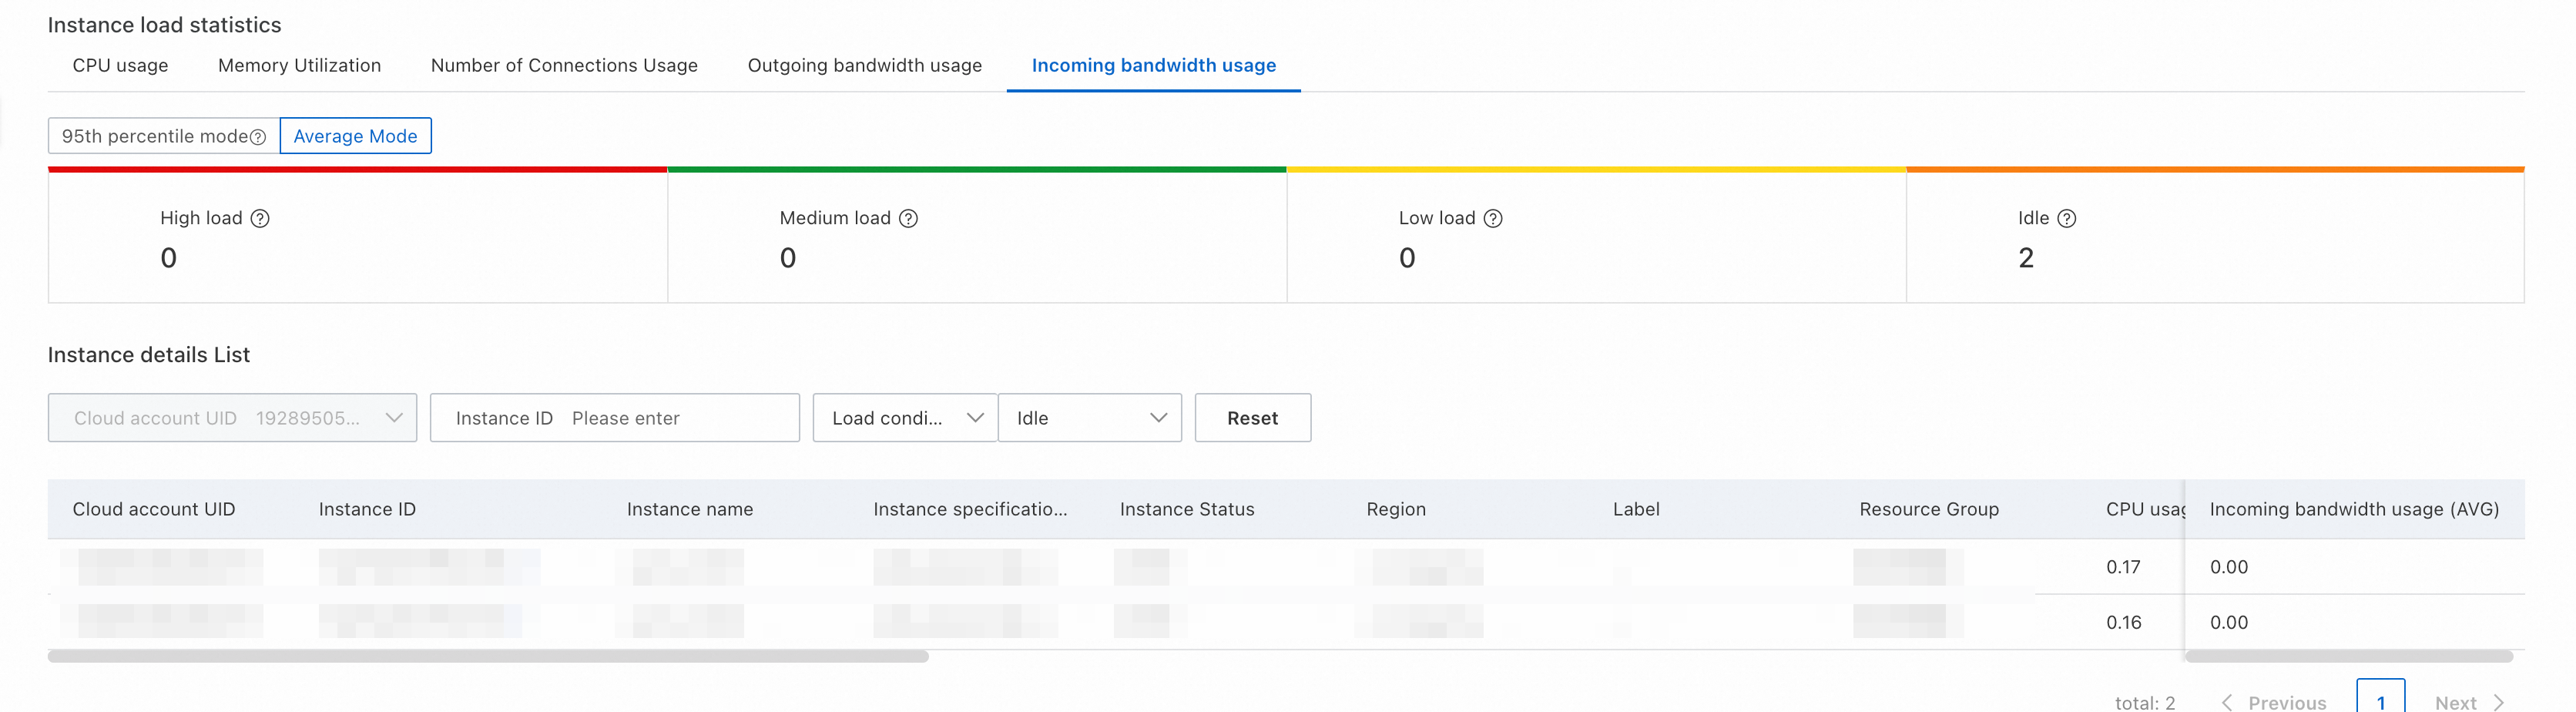
Click a metric tab to view detailed data in 95th percentile mode or average mode.

The load statistics show how many instances fall into each load state.

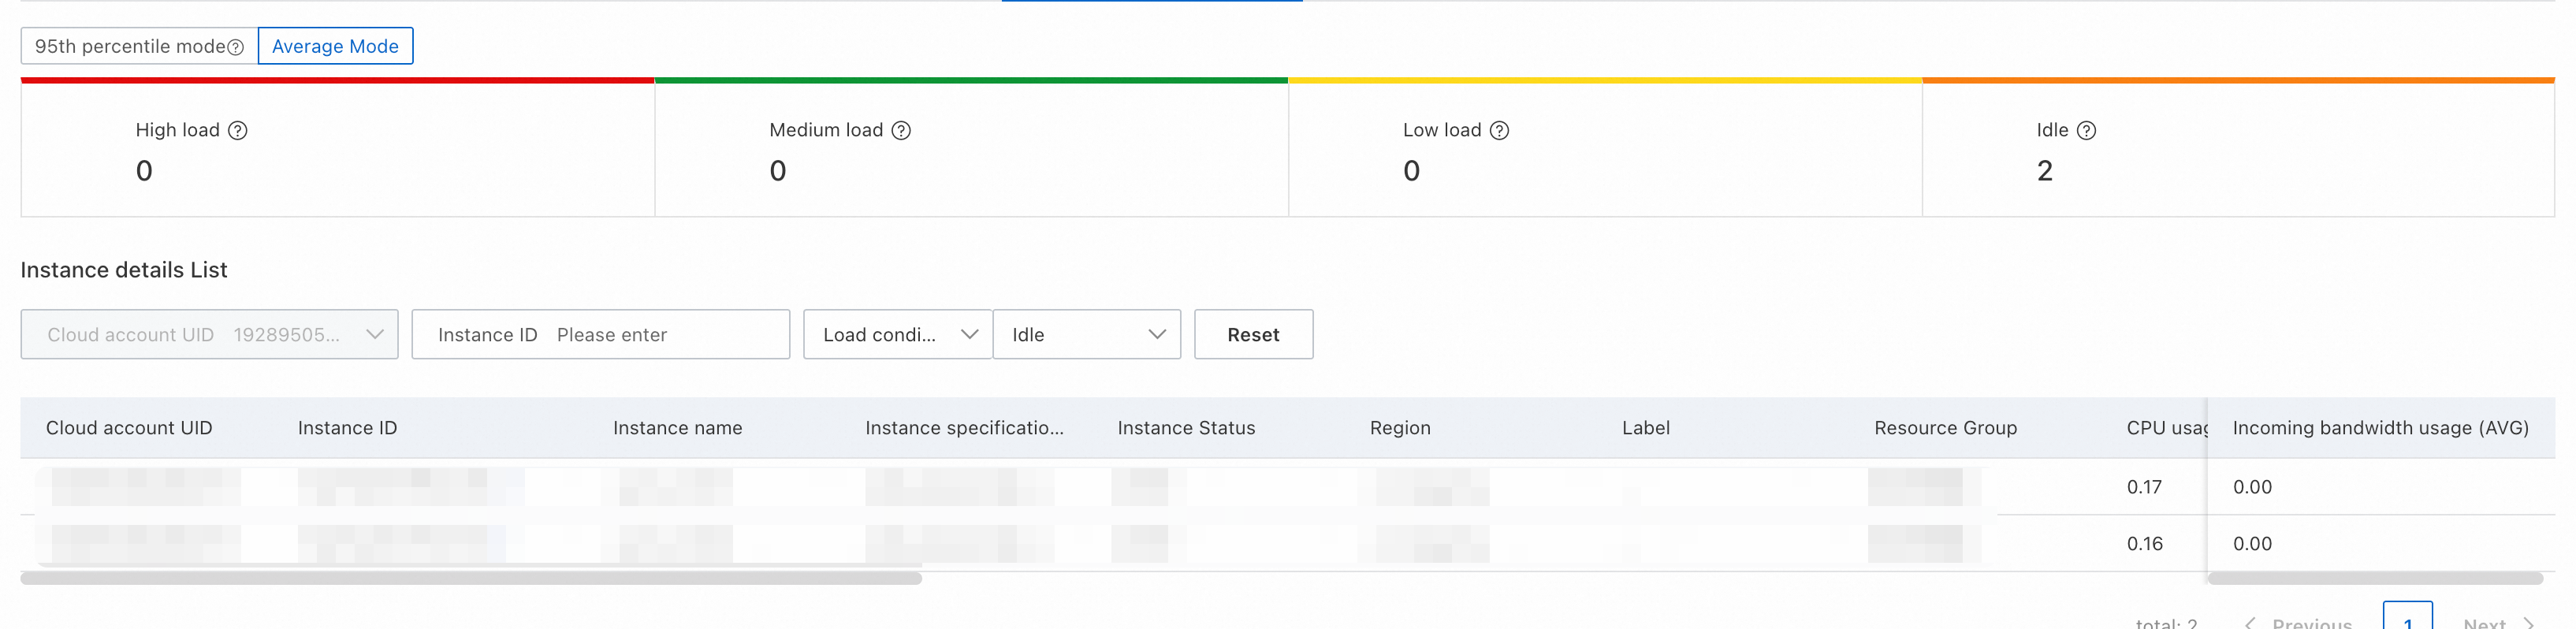
The Instance details list section shows metric data for all instances of the selected service. Filter or export the data based on your needs.
What's next
If risks are detected before the cutover, address the capacity issues on the target resources or resize the instances before proceeding with the cutover.
To prepare a rollback path, see Create reverse DTS tasks to set up reverse Data Transmission Service (DTS) tasks that replicate data back to the source environment if the cutover fails.