General performance
This topic describes the standard performance metrics for the Cloud Managed Network (CMN) platform.
Background information
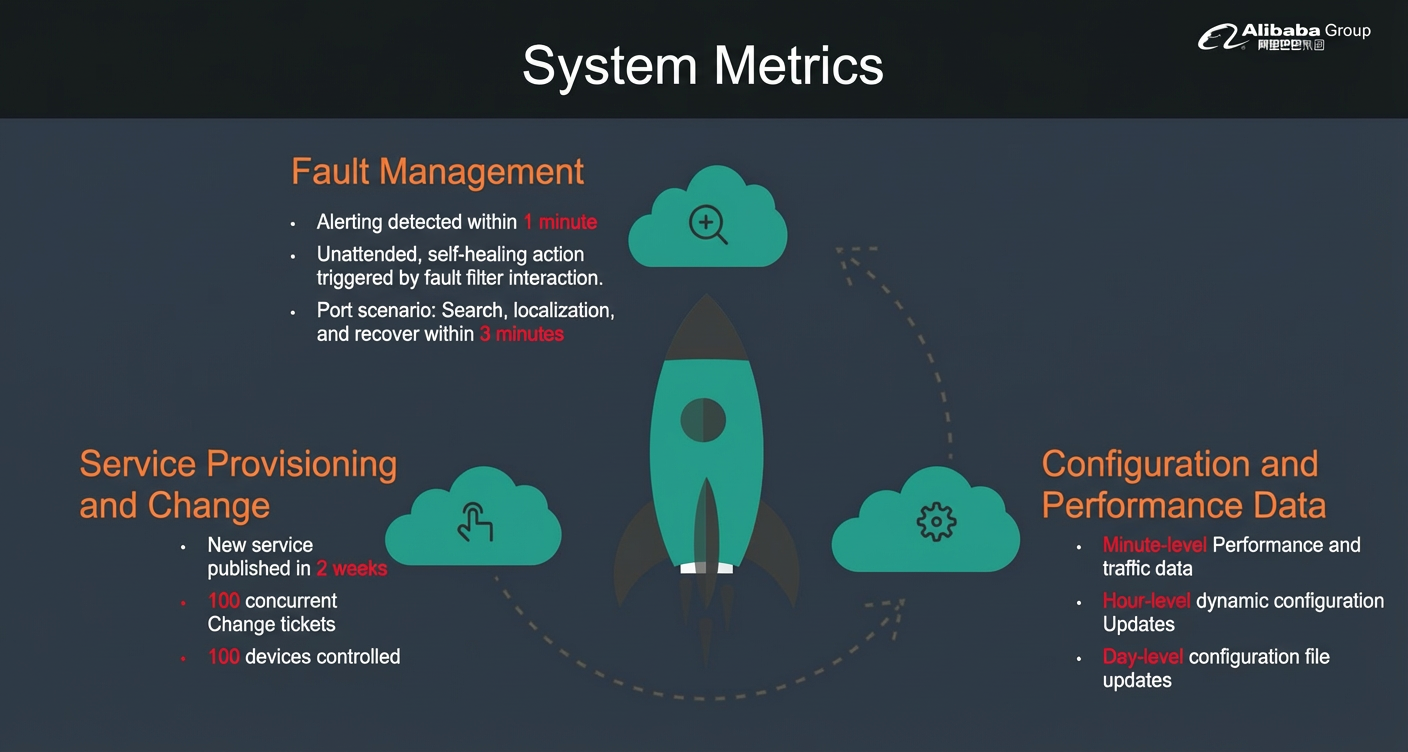
For service monitoring, the system collects, reports, analyzes, and displays all metrics at a one-minute granularity. For network inspection and configuration, the system separates user logic from device logic. It uses customizable open templates. This accelerates the deployment of network service configurations. On average, developing and publishing a new service, from device adaptation to automated execution, takes only two weeks. The network orchestration and execution engine can concurrently process 100 tickets and configure 100 network devices. This greatly improves configuration efficiency. For business management, the system supports key features such as dynamic configuration file retrieval for devices and automatic topology discovery. It provides feedback on the infrastructure status at an hourly granularity.
System metrics
Metric details
Dimension | Capability | Description |
System deployment | Automatic agent registration | Agents can be onboarded in a cluster based on the required scale. High availability (HA) failover completes within one minute. |
System performance | Peak automation call performance: 100/minute | Automated task delivery |
Concurrent call performance: 100 devices configured in parallel | ||
System stability | Dynamic scale-out capability: All components can be dynamically scaled out. | Supports active-standby load balancing. |
System maintainability | All core capabilities are built on an open platform and support custom development. | |
Collection | Comprehensive protocol support | Secure Shell (SSH), Telnet, gRPC, NETCONF, PING, HTTP, Simple Network Management Protocol (SNMP), TCP-PING |
Collection performance: 1,000/second per process | command-line interface (CLI) instruction delivery | |
Open Capabilities: Customizable collection and parsing | Commands, Object Identifiers (OIDs), and other items can have custom configuration and parsing templates. | |
Alerting | Mainstream protocol support | SNMPtrap, Syslog, PING (also supports performance metric alerts from collection) |
Alert parsing capability: Supported | The real-time computing engine analyzes and stores 10,000 records/second. | |
Fault convergence capability: Supported | Compresses and merges alerts based on rules and topology. | |
Diagnostic and self-healing capability: Supported | Executes pre-analysis and automated control tasks. For device scenarios, it achieves 1-minute discovery, 1-minute diagnosis, and 1-minute recovery. | |
Open Capabilities: Analysis, decision-making, and execution | Customizable alert rules and analysis. | |
Provisioning and changes | Comprehensive protocol support | SSH, Telnet, gRPC, NETCONF, REST |
Execution performance: 1,000/second per process | CLI instructions | |
Open Capabilities: Fully open general capabilities for customizing flows and business logic | Provisioning plans, service templates, and device templates | |
Inspection | Comprehensive protocol support | SSH, Telnet, gRPC, NETCONF, REST |
Execution performance: 1,000/second per process | Supports priority queues so that inspection and configuration do not affect each other. | |
Open Capabilities: Open general capabilities for customizing flows and business logic (visual orchestration + custom code) | Inspection templates and health check rules |