Analyze the metric write volume of Managed Service for Prometheus, identify high-cost sources such as instances, jobs, and metrics, and apply optimization strategies to reduce costs.
Managed Service for Prometheus charges a metric ingestion fee and a storage fee. For more information, see Billing overview. To optimize usage, first identify the instances, jobs, and metrics with high write volumes by using the usage analysis, metric statistics, and metric governance features.
Usage analysis
1. Analyze by instance
Review all your Prometheus instances to identify those with high usage.
-
Log in to the Cloud Monitor console.
-
In the left-side navigation pane, click .
-
In the Instance Usage Overview area, view billing-related statistics for each instance, such as reported data volume, written data volume, and archived storage volume.
-
Recommendation: Sort by Custom Metric Reported Volume (Millions) or Custom Metric Written Volume (GB) in descending order to find the instances with the highest metric ingestion.
The Instance Usage Overview panel displays usage data for each instance in a table. In addition to custom metric columns, the table includes Instance ID, Instance Name, Region, Basic Metric Reported Volume (Millions), and Basic Metric Written Volume (GB). Use this information to compare basic and custom metric usage across instances.
-
Reported data volume and written data volume are two different billing methods for data ingestion into a Prometheus instance. You can choose one of these methods. A high reported data volume typically corresponds to a high written data volume. For more information, see Billing overview.
2. Analyze by job
After analyzing usage by instance, drill down into high-usage instances to identify the jobs that generate the most data.
-
On the Usage Analysis dashboard, filter for the instance you want to analyze.
-
View the job rankings:
-
In the to view the top 10 custom jobs by reported data volume.
-
In the to view the top 10 jobs by written data volume.
The Top 10 Custom Jobs by Written Volume panel displays information for the top 10 jobs by write volume in a table. The table includes the Job Name, Written Volume (Bytes), and Percentage columns.
-
3. Analyze by metric
To identify the specific metrics that cause high usage, analyze them within the relevant Prometheus instance.
-
In the left-side navigation pane, select Instance List, and then click the name of the target instance to open its details page.
-
In the left-side navigation pane, select Metric Management and then click the Metric Statistics tab:
-
Top 10 Metrics by Data Point Count: View the metrics with the highest reported data volume.
-
Top 10 Metrics by Data Volume: View the metrics with the highest written data volume.
-
-
You can also filter the dashboard by the high-volume jobs identified in the previous step.
The data point count and data volume on the Metric Statistics tab are calculated in real time. There may be a discrepancy between these statistics and the actual reported or written volume on your bill. Your final bill takes precedence.
4. Analyze high-cardinality metrics
In Prometheus, high cardinality refers to an unusually large number of time series, typically caused by too many label combinations for a metric. This often happens when divergent values such as user IDs are stored in a label.
The page provides statistics for time series and labels:
-
Metric Quick Analysis: View the top N metrics by the number of time series in the current instance.
-
Label Quick Analysis: View an analysis of the top N labels by the number of values. You can also filter by a specific metric.
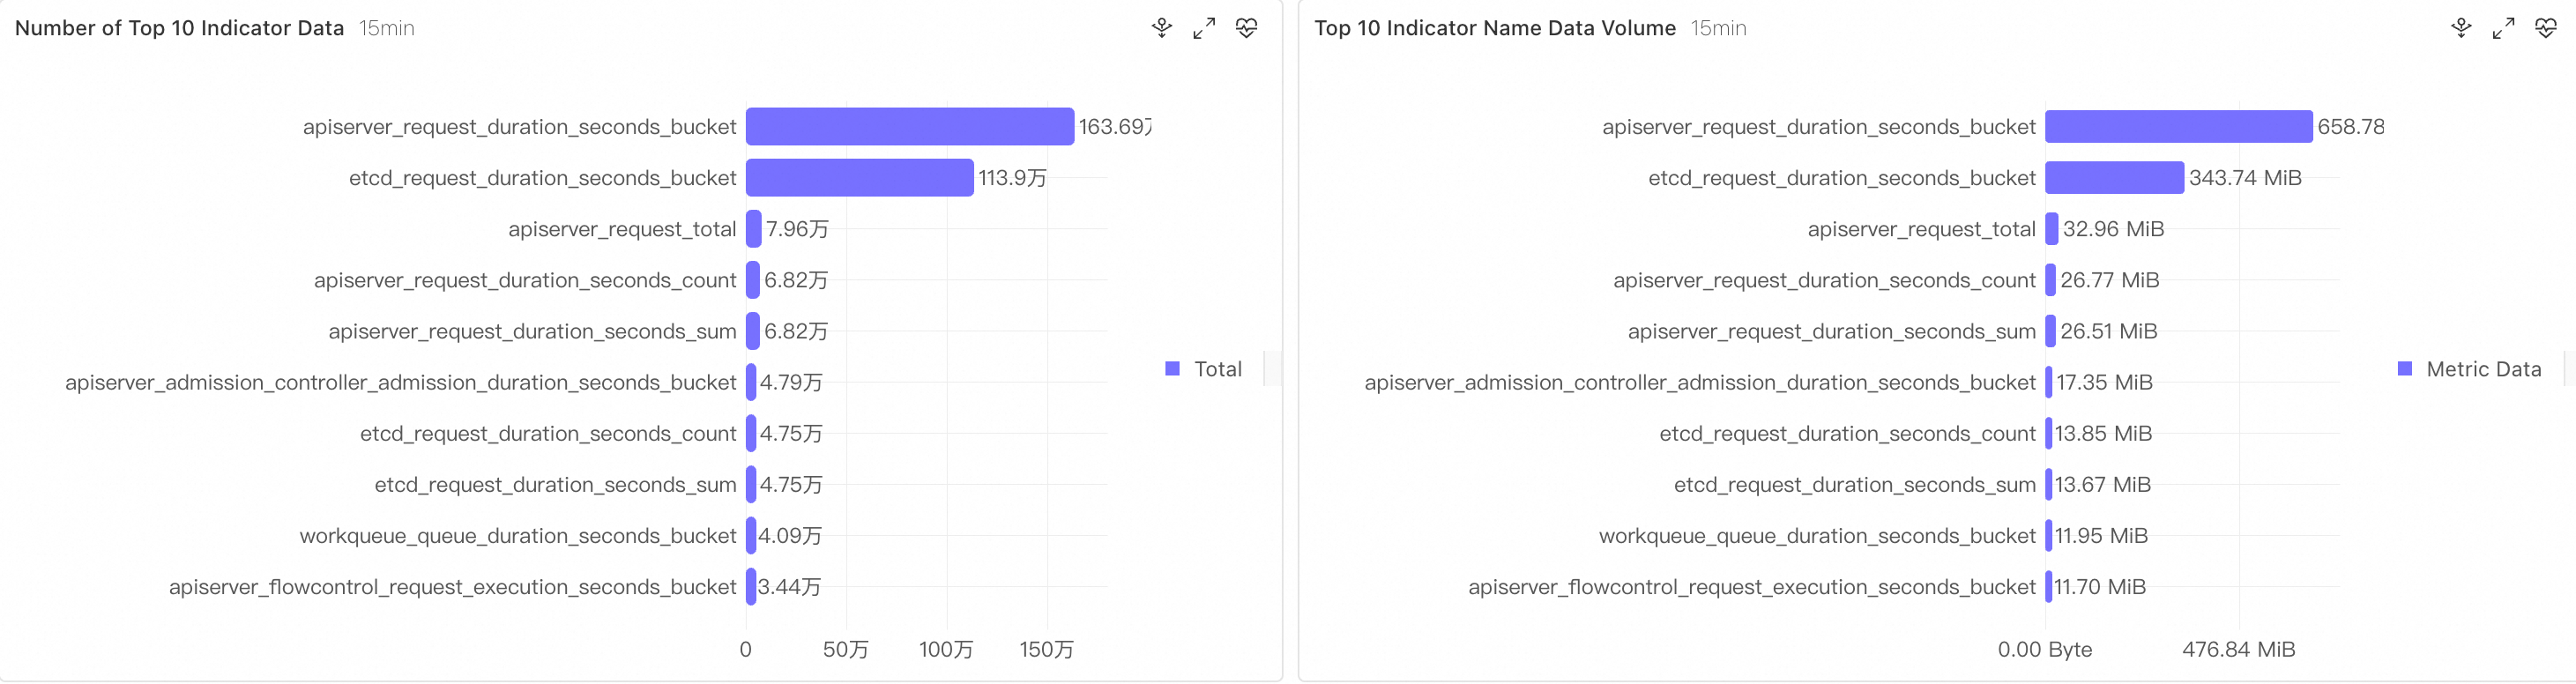
The Metric Quick Analysis (15 min) panel lists the metric name, number of time series, total count, and a time series sample. In the example, the top N metrics include apiserver_request_duration_seconds_bucket (26,153/1,637,280), etcd_request_duration_seconds_bucket (19,435/1,139,040), and apiserver_request_total (1,345/79,560). The Label Quick Analysis (15 min) panel lists the label key, number of unique values, total count, and a label value sample. In the example, high-cardinality labels include name (402/188,202), resource (228/3,062,640), le (200/3,066,720), and instance (26/3,790,422).
Cost optimization strategies
Based on the insights from your usage analysis, apply the following strategies to reduce costs.
Strategy 1: Choose a billing method
Managed Service for Prometheus offers two billing methods at the instance level: by written data volume and by reported data volume. Use the Usage Statistics page to determine which method is more cost-effective for your workload.
-
Procedure: In the Settings of your Prometheus instance, switch the billing method.
-
Limitation: You can switch the billing method for an instance only once.
In the Basic Information panel of the instance, click the edit icon next to Billing Method to switch.
Strategy 2: Increase the scrape interval
-
On the Integration Management page, click the name of the environment that you want to configure.
-
In Component Management, find the component to configure, and then click Settings in the Actions column.
-
On the configuration page, set the Scraping Interval (seconds).
For example, set it to 15.
Strategy 3: Drop unused metrics
-
In the left-side navigation pane, select . In the Actions column for the target environment, click Metric Scraping.
-
On the metric scraping page, click Discard Metrics and enter the metrics to drop.
-
If metrics are scraped by an open source Prometheus instance and then sent to Managed Service for Prometheus using Remote Write, use
metric_relabel_configsin the scrape configuration to drop unwanted metrics. For more information, see Examples of common use cases for metric_relabel_configs. -
You can also use
write_relabel_configsduring the Remote Write stage to configure which metrics to drop.
-
Strategy 4: Optimize high-cardinality metrics
-
Avoid divergent labels: At the metric source, do not use labels with high cardinality, such as user IDs, order IDs, or trace IDs.
-
Normalize labels: If a label stores variable values, such as a URL path, normalize the label. For example, change
/api/user/123/profileto/api/user/:id/profile.
Summary
The following table compares the optimization strategies.
|
Optimization strategy |
Scope |
Limitations |
Implementation difficulty |
|
Choose the right billing method for your instance |
Instance level |
You can switch the billing method for an instance only once. |
Low |
|
Increase the scrape interval |
Job level |
Not supported for cloud service metrics, which typically have a 1-minute granularity. |
Medium |
|
Drop unused metrics |
Metric level |
Dropping advanced metrics for cloud services is not supported. |
Medium |
|
Optimize high-cardinality metrics |
Metric level |
Requires adjusting the scrape logic. |
High |