Exception analysis
After you install an agent for an application, Cloud Monitor 2.0 begins monitoring it. On the Exception Analysis page, you can filter and analyze exceptions by exception name, interface name, and host to optimize your code.
What is an exception
In ARMS Exception Analysis, ARMS collects only the exceptions that are thrown by instrumented methods. In a real workload, a single interface call may therefore record no exception at all, or one or more exceptions.
For example, assume that the ARMS agent instruments two public int methods, methodA and methodB, and that the two methods call each other. The exceptions that ARMS records differ across the following scenarios.
Scenario 1: methodA and methodB each catch and print their own exception
ARMS does not monitor any exception.
public int methodA() {
        try {
            return methodB();
        } catch (Throwable e) {
            e.printStackTrace();
            return 0;
        }
    }
    public int methodB() {
        try {
            return 1 / 0;
        } catch (Throwable e) {
            e.printStackTrace();
            return 0;
        }
    }
Scenario 2: methodA catches and prints the exception, and methodB throws the exception
ARMS monitors one java.lang.ArithmeticException exception.
public int methodA() {
        try {
            return methodB();
        } catch (Throwable e) {
            e.printStackTrace();
            return 0;
        }
    }
    public int methodB() {
        return 1 / 0;
    }
Scenario 3: methodA and methodB each throw an exception
ARMS monitors two java.lang.ArithmeticException exceptions.
public int methodA() {
        return methodB();
    }
    public int methodB() {
        return 1 / 0;
    }
Scenario 4: methodA wraps and throws the exception, and methodB throws the exception
ARMS monitors one java.lang.ArithmeticException exception and one java.lang.RuntimeException exception.
public int methodA() {
        try {
            return methodB();
        } catch (Throwable e) {
            throw new RuntimeException(e);
        }
    }
    public int methodB() {
        return 1 / 0;
    }
Prerequisites
The application must be connected to Cloud Monitor 2.0.
Try in Playground
Alibaba Cloud Playground provides a demo environment where you can experience the main features of Cloud Monitor 2.0.
-
Visit the Playground demo. By default, you are logged on to the
o11y-demo-cn-hangzhouworkspace. -
In the left navigation pane, choose .
View in console
Log on to the Cloud Monitor 2.0 console, and select a workspace. In the left navigation pane, choose .
-
On the Applications page, click an application. Then, choose .
-
In the Quick Filter section, filter exceptions by exception name, interface name, application, and instance.
-
The trend charts show exception counts over a specified time period, with bars stacked by exception name.
-
The exception list shows the interface name, exception count, proportion, and exception summary.
In the Actions column, you can:
-
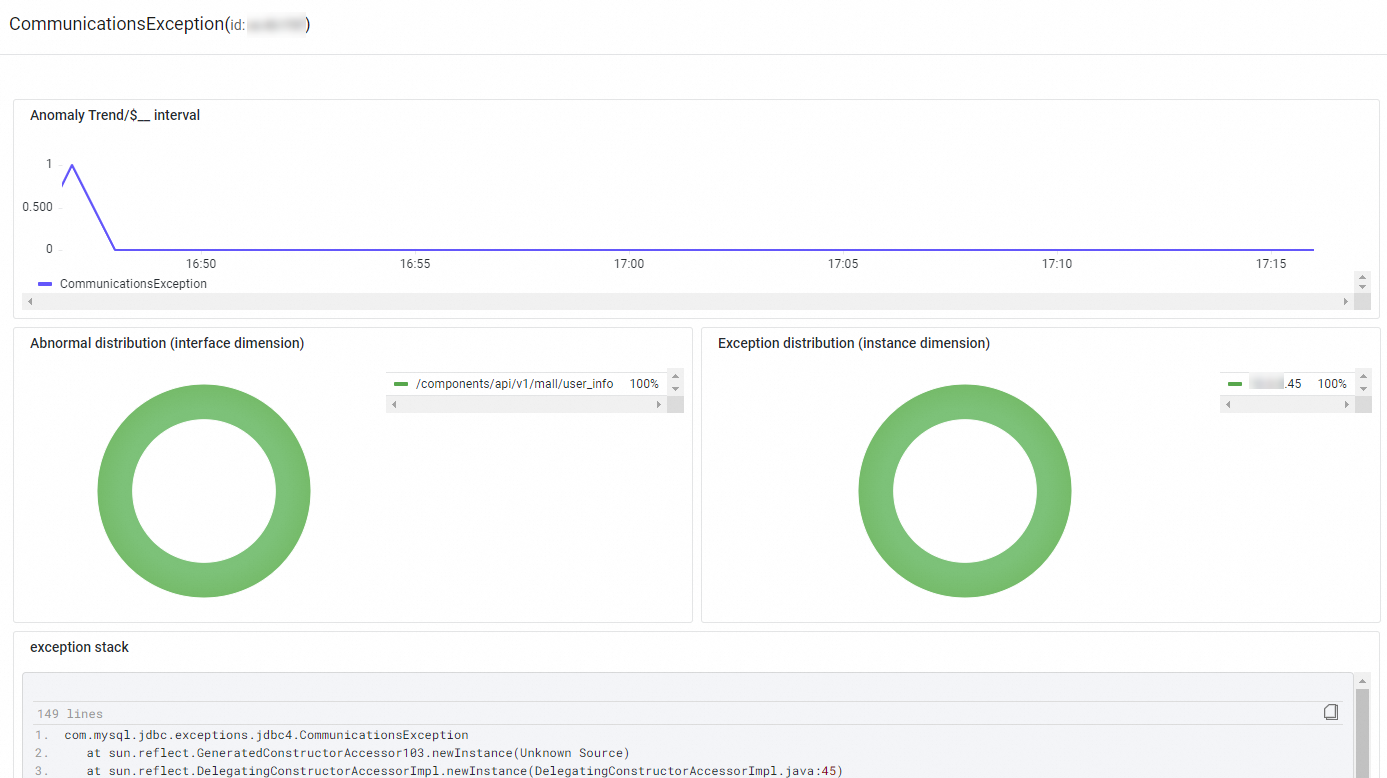
Click Overview to view the exception count trend, distribution by interface and instance, and exception stack.
-
Click Traces to view trace details.
-
-