Metric Explorer
Use Metric Explorer to query and analyze metrics for your Hologres instances.
Prerequisites
Procedure
-
Log on to the CloudMonitor 2.0 console, select the target workspace, and in the navigation pane on the left, choose All Features > Hologres Insight.
-
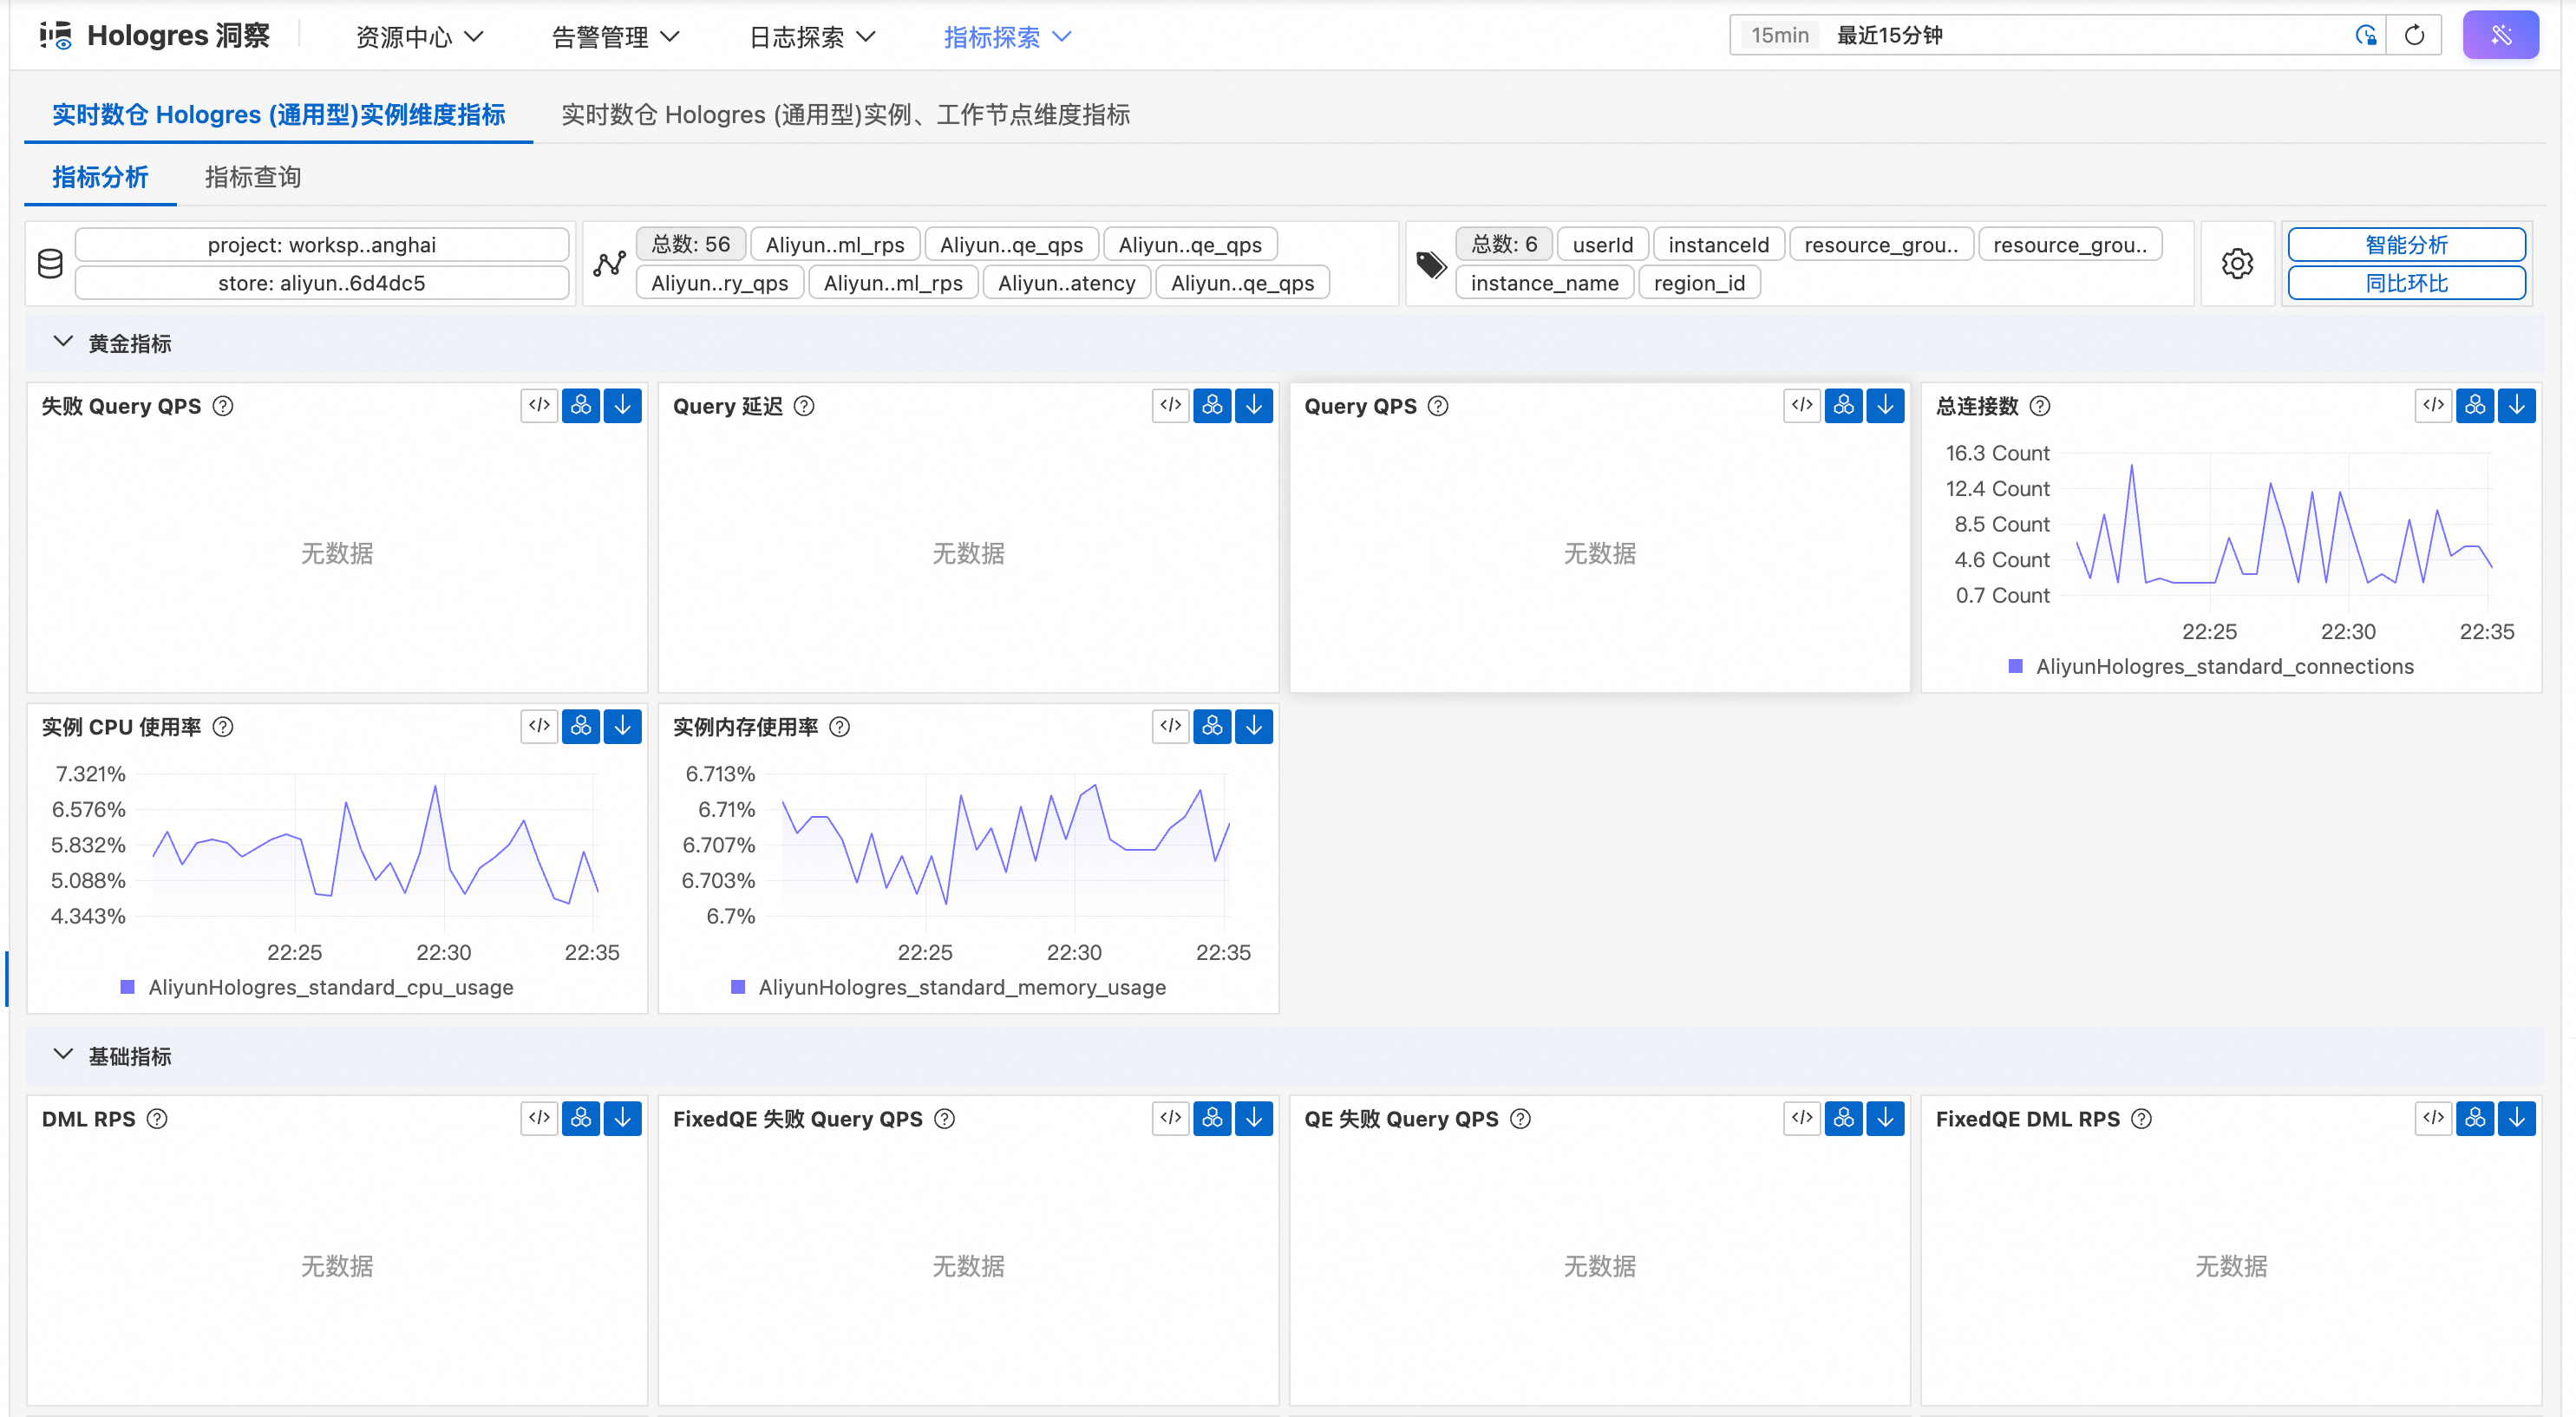
In the top navigation bar, select Metric Explorer to query and analyze metrics across different instance types and dimensions.
-
Query CloudMonitor metrics for connected Hologres instances. Agentless metrics (CloudMonitor metrics) are prefixed with AliyunHologres_***. Use the tabs at the top of the page to switch between metric dimensions, such as Hologres real-time data warehouse (compute group) instance metrics. Select a target instance, and then enter a query statement, such as
AliyunHologres_connection_count{}, in the Metrics exploration section. A line chart below shows the trend of the metric. -
In the top navigation bar, select Resource Center. Click the target instance ID to view detailed insights for the entity.
-
Select Metric Explorer to view the metric sets for the current entity.
-
Select a metric set to view its data for the current instance, including trends, anomaly detection, and drill-down analysis.