The Resource Center provides a centralized view of your Hologres instances and their observability data.
Prerequisites
You are connected to Hologres.
Instance list
Hologres instances
In Hologres Insight, go to Resource Center > Hologres Instance List to view the list of Hologres instances.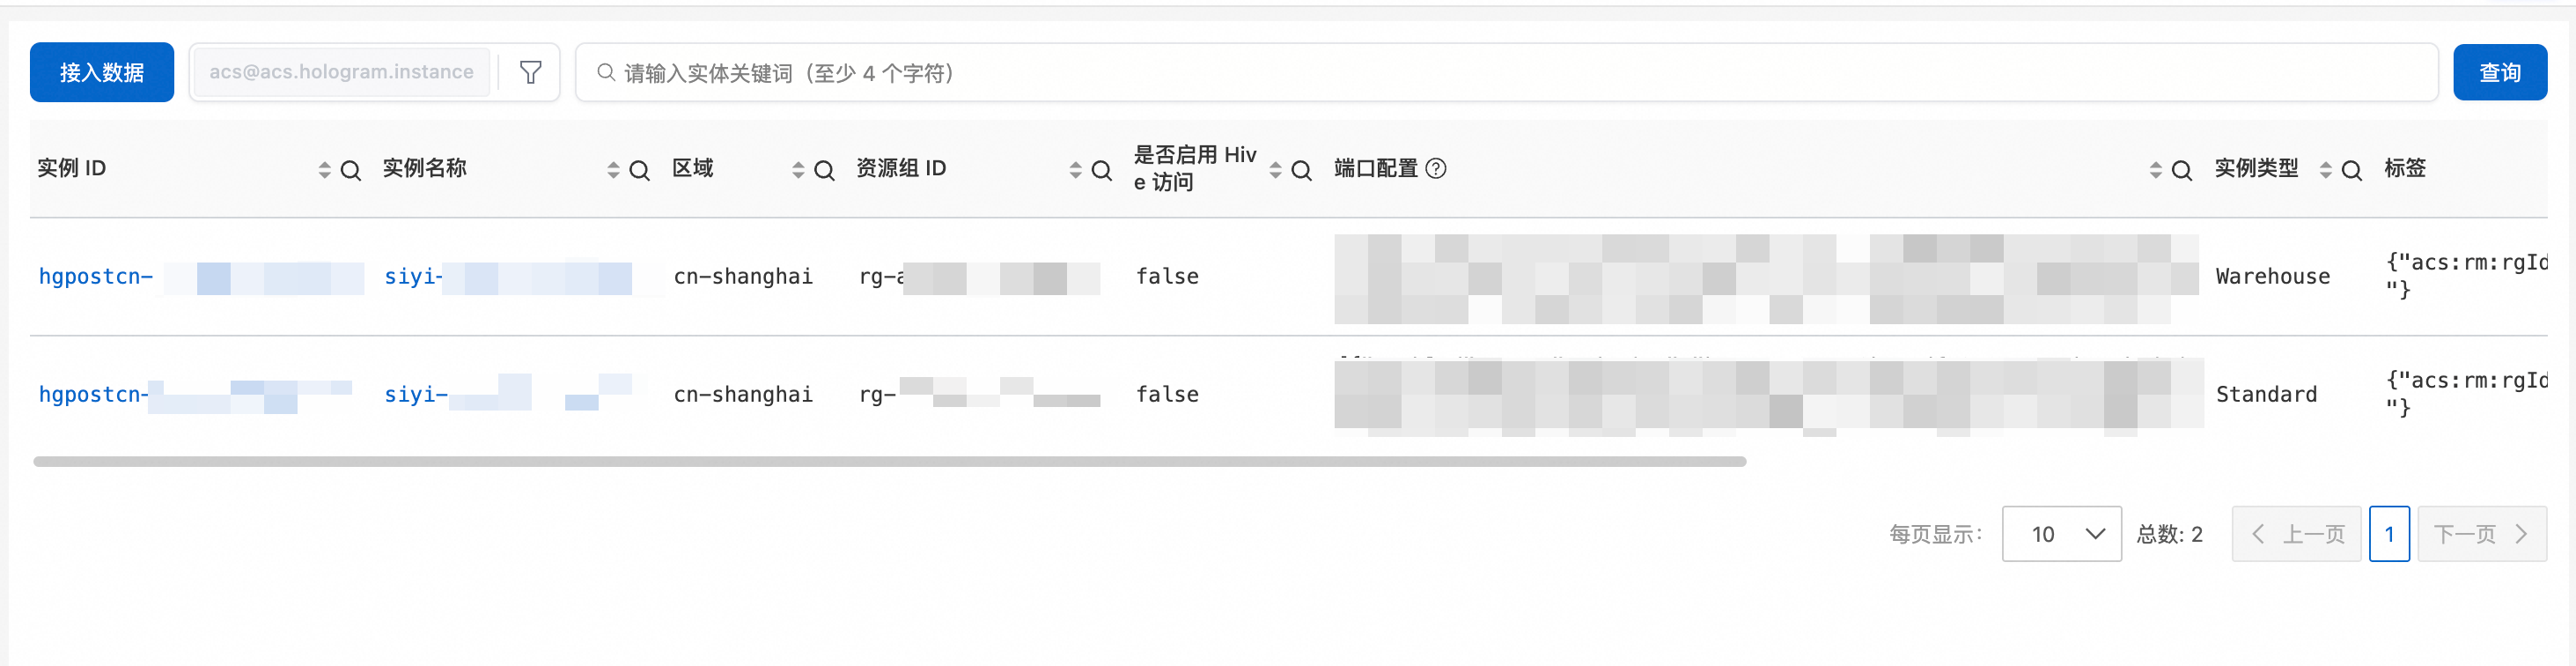
Query conditions
Set query conditions to filter instances. For example:
-
domain = acs
-
type = acs.hologram.instance
Instance overview
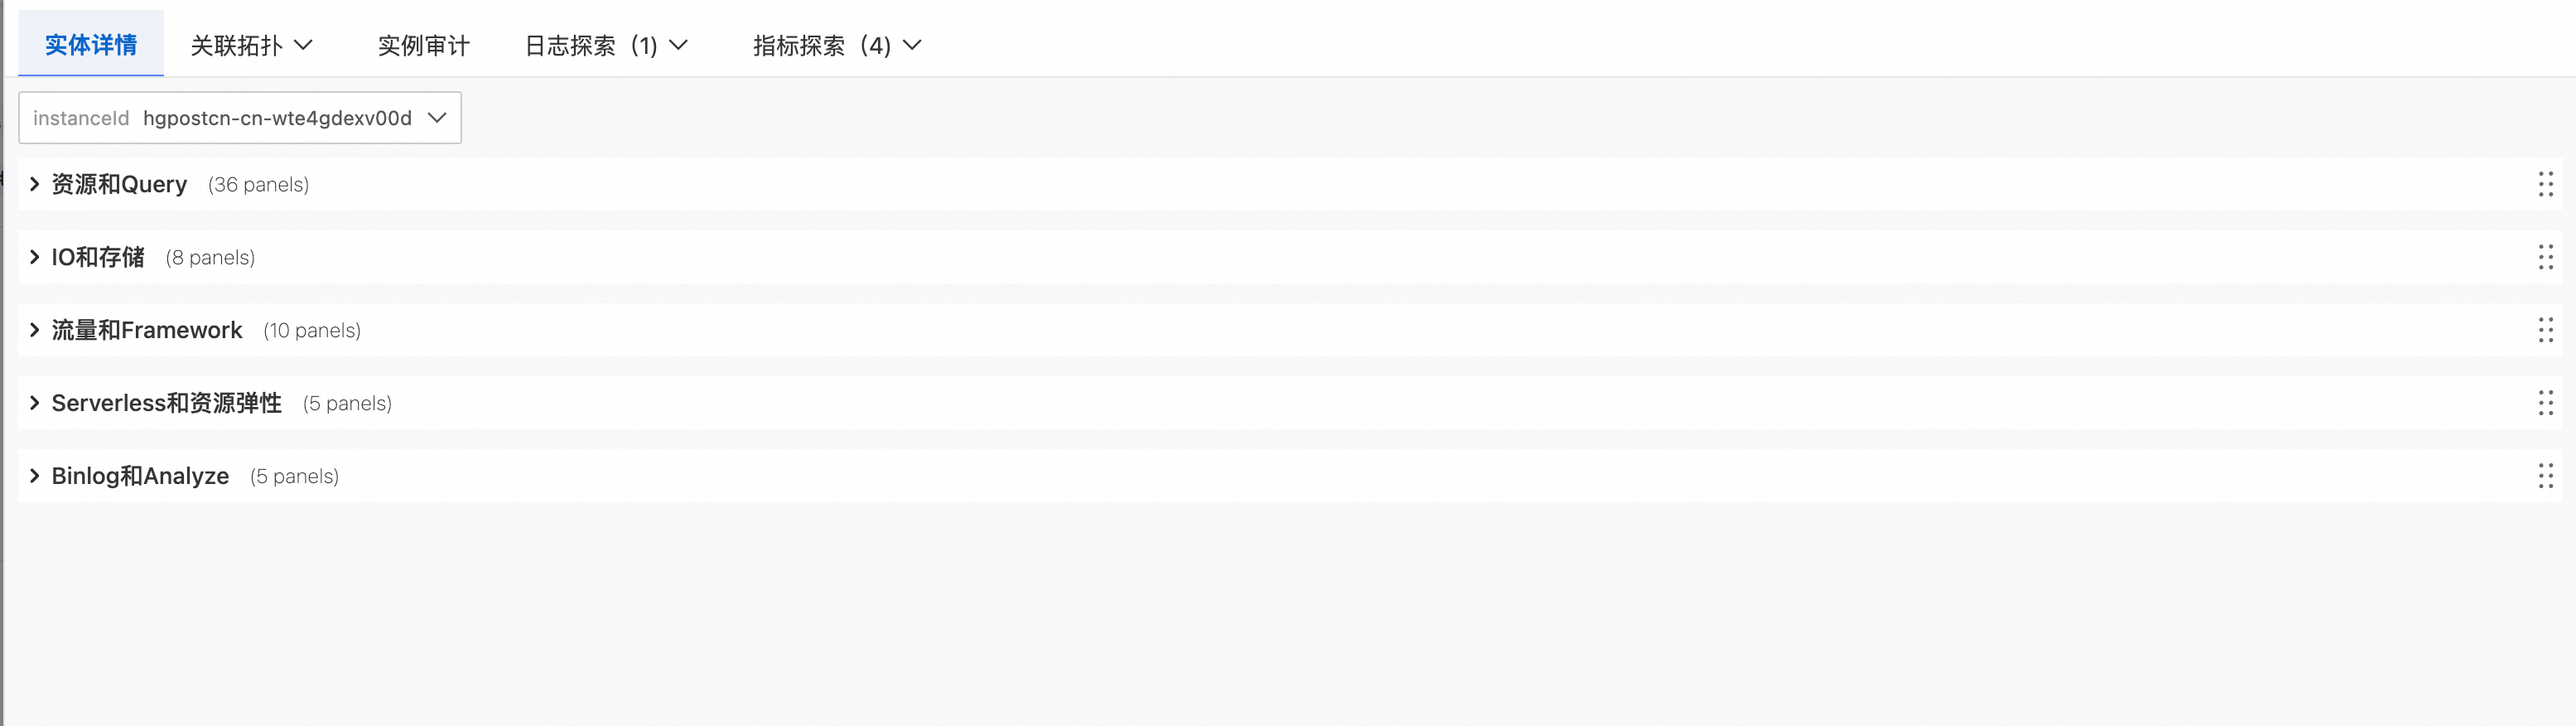
Click a Hologres instance ID or name to open its overview. The overview page displays observability data for a single instance. After you connect to Cloud Monitor metrics, a basic dashboard for the instance appears with the following sections:
-
Resources and Queries
-
IO and Storage
-
Traffic and Framework
-
Serverless and Resource Elasticity
-
Binlog and Analyze
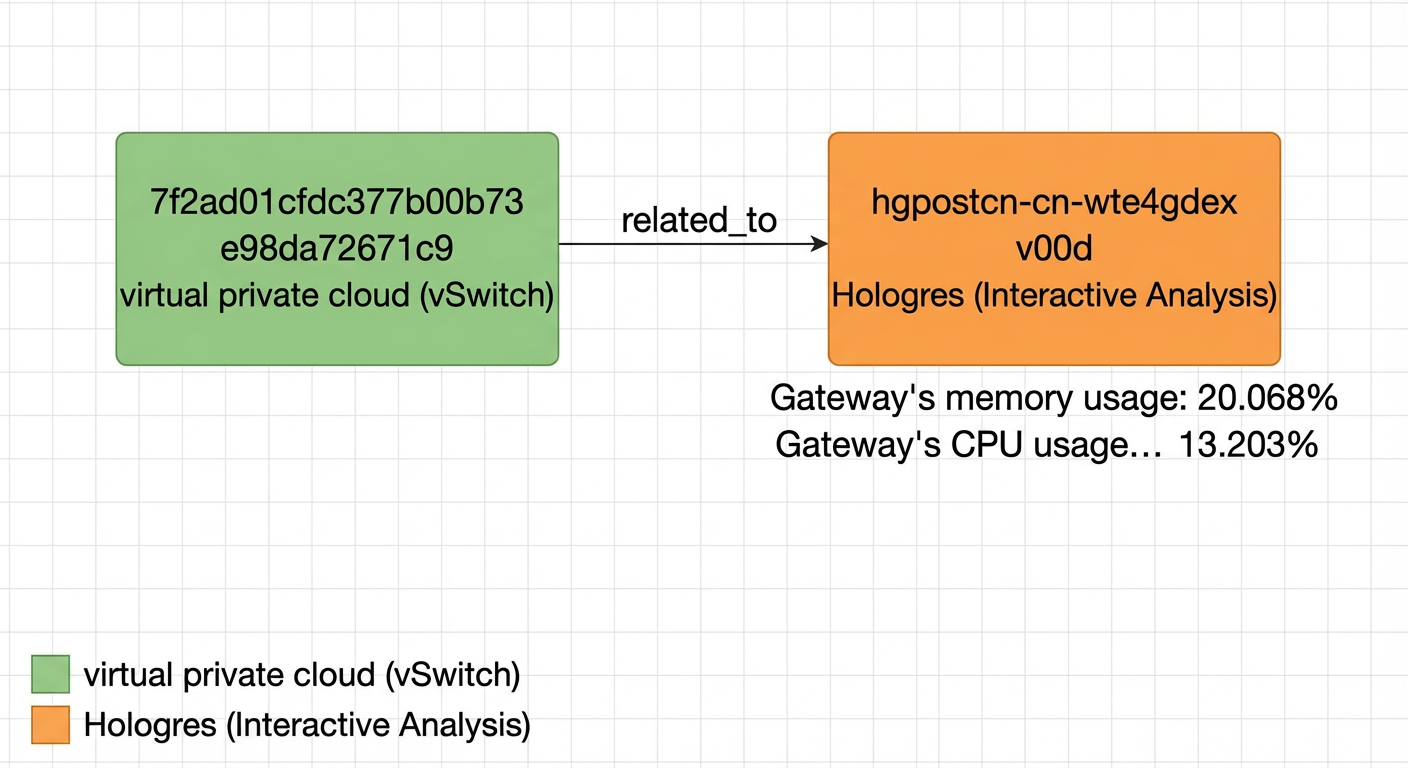
Associated topology
View the upstream and downstream network topology associated with the instance.
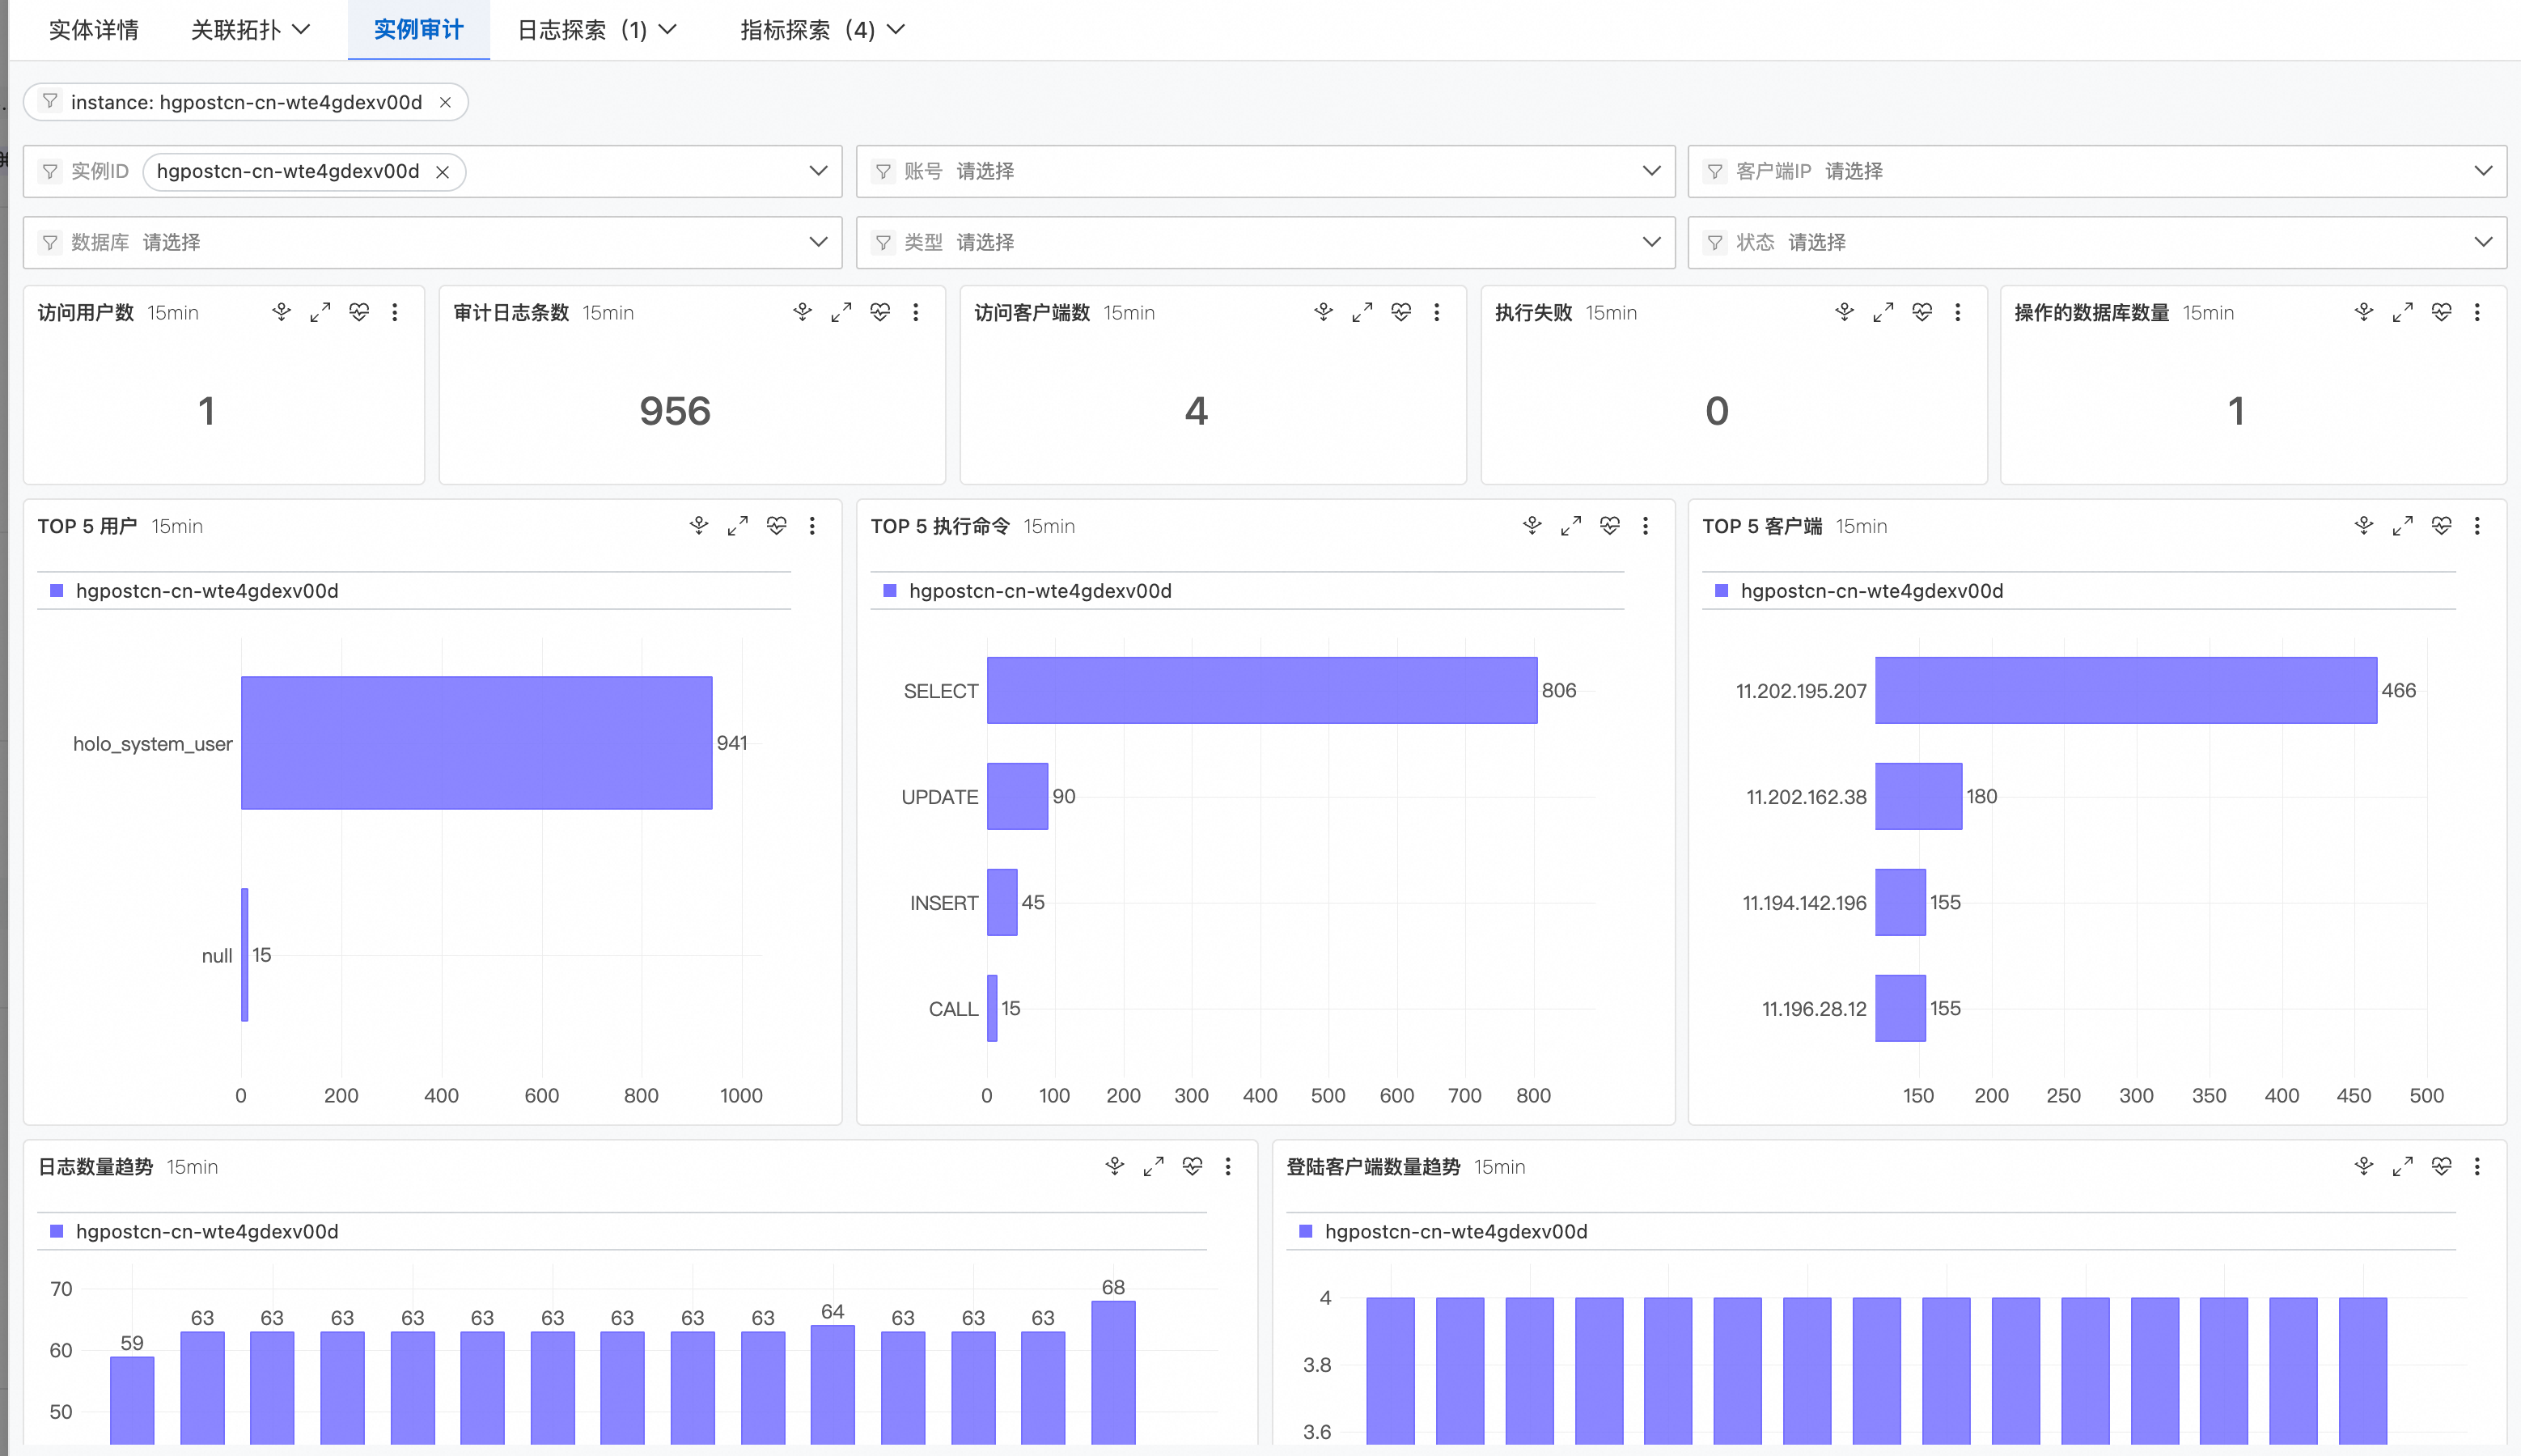
Instance audit
-
By default, the instance audit is filtered by the current Hologres instance ID. You can set a time range for the audit log analysis and manually refresh or reset the time as needed.
-
You can set multiple conditions to filter audit logs and generate reports. These conditions include instance ID, database, username, type, client IP, and status.
-
The system analyzes SQL Audit logs, aggregates the data, and displays the results in charts.
-
The statistics area displays metrics such as the number of users, audit log entries, client connections, failed executions, and the number of accessed databases.
-
You can view trend charts for key metrics, such as Top 5 Users, Top 5 Executed Commands, and Top 5 Clients.
-
The trend analysis area displays trends such as the number of logs and the number of client logons.
-
You can view a detailed list of audit logs. The list includes details such as instance ID, username, authentication information, client IP, collection time, database, type, status, query, start time, end time, and duration.
-