After you instrument an application with OpenTelemetry and report trace data to Cloud Monitor 2.0, you can view application topology, call traces, abnormal transactions, slow transactions, and SQL analysis. OpenTelemetry supports automatic instrumentation with the Java Agent or manual instrumentation with the SDK.
Background information
The OpenTelemetry Java Agent supports automatic instrumentation for many Java frameworks. For a complete list, see Supported Libraries and Versions.
Step 1: Obtain endpoint information
Log on to the Cloud Monitor 2.0 console, and select a workspace. In the left navigation pane, click Integration Center.
-
In the APM & Tracing section, click the Java card. Then, set Operating environment type to Manual Installation and Select Java Protocol to Opentelemetry.
-
In the Parameter Configurations section, click Click to get next to LicenseKey. Then, select the Instrumentation Type, Connection Type, and Export Protocol as needed. Enter the Service Name, Version, and Environment.
The corresponding integration code is generated at the bottom of the page based on the configured parameters. The code contains endpoint information such as the Endpoint and LicenseKey.
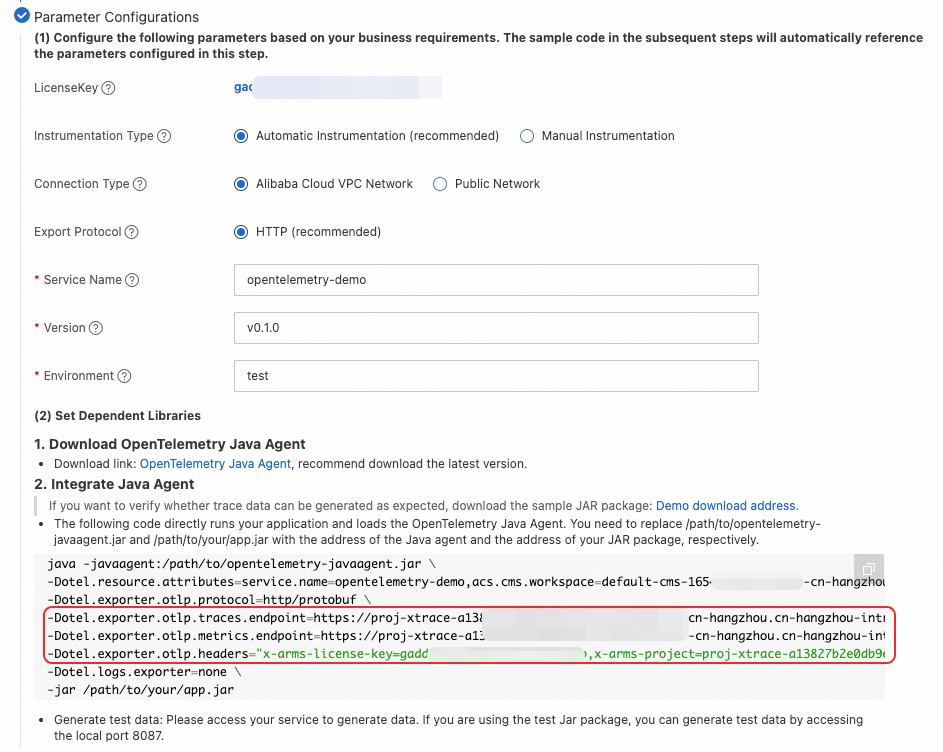
Step 2: Set up dependency libraries
Automatic instrumentation (recommended)
The OpenTelemetry Java Agent automatically instruments hundreds of Java frameworks without code changes. For supported frameworks, see Supported Libraries and Versions.
-
Download the Java Agent. The latest version is recommended.
-
Report trace data by modifying the VM parameters for Java startup.
The following code runs your application and loads the OpenTelemetry Java Agent. Replace the placeholders in the following code with the endpoint information that you obtained in Step 1. Replace
/path/to/opentelemetry-javaagent.jarand/path/to/your/app.jarwith the actual paths to the Java Agent and your JAR package.java -javaagent:/path/to/opentelemetry-javaagent.jar \ -Dotel.resource.attributes=service.name=<service name>,acs.cms.workspace=<workspace>,service.version=<service version>,deployment.environment=<environment> \ -Dotel.exporter.otlp.protocol=http/protobuf \ -Dotel.exporter.otlp.traces.endpoint=<traces.endpoint> \ -Dotel.exporter.otlp.metrics.endpoint=<metrics.endpoint> \ -Dotel.exporter.otlp.headers="x-arms-license-key=<license-key>,x-arms-project=<arms-project>,x-cms-workspace=<workspace>" \ -Dotel.logs.exporter=none \ -jar /path/to/your/app.jarNoteTo generate test data, access your service. If you are using a test JAR package, you can access port 8087 on your local machine to generate test data.
-
Run the program to generate and report trace data.
Manual instrumentation
The OpenTelemetry Java SDK is the foundation for the Java Agent and offers extensive customization. Use this method if automatic instrumentation does not meet your needs or you want to add custom business instrumentation.
-
Import the Maven POM dependencies.
<dependencies> <dependency> <groupId>io.opentelemetry</groupId> <artifactId>opentelemetry-api</artifactId> </dependency> <dependency> <groupId>io.opentelemetry</groupId> <artifactId>opentelemetry-sdk-trace</artifactId> </dependency> <dependency> <groupId>io.opentelemetry</groupId> <artifactId>opentelemetry-exporter-otlp</artifactId> </dependency> <dependency> <groupId>io.opentelemetry</groupId> <artifactId>opentelemetry-sdk</artifactId> </dependency> <dependency> <groupId>io.opentelemetry</groupId> <artifactId>opentelemetry-semconv</artifactId> <version>1.30.0-alpha</version> </dependency> </dependencies> <dependencyManagement> <dependencies> <dependency> <groupId>io.opentelemetry</groupId> <artifactId>opentelemetry-bom</artifactId> <version>1.30.0</version> <type>pom</type> <scope>import</scope> </dependency> </dependencies> </dependencyManagement> -
Obtain the OpenTelemetry Tracer.
import io.opentelemetry.api.OpenTelemetry; import io.opentelemetry.api.common.Attributes; import io.opentelemetry.api.trace.Tracer; import io.opentelemetry.api.trace.propagation.W3CTraceContextPropagator; import io.opentelemetry.context.propagation.ContextPropagators; import io.opentelemetry.exporter.otlp.http.trace.OtlpHttpSpanExporter; import io.opentelemetry.sdk.OpenTelemetrySdk; import io.opentelemetry.sdk.resources.Resource; import io.opentelemetry.sdk.trace.SdkTracerProvider; import io.opentelemetry.sdk.trace.export.BatchSpanProcessor; import io.opentelemetry.semconv.resource.attributes.ResourceAttributes; public class OpenTelemetrySupport { static { // Obtain the OpenTelemetry Tracer. Resource resource = Resource.getDefault() .merge(Resource.create(Attributes.of( ResourceAttributes.SERVICE_NAME, "<service name>", // Application name. ResourceAttributes.SERVICE_VERSION, "<service version>", // Version number. ResourceAttributes.DEPLOYMENT_ENVIRONMENT, "<environment>", // Deployment environment. ResourceAttributes.HOST_NAME, "${host-name}", // Replace ${host-name} with your hostname. AttributeKey.stringKey("acs.cms.workspace"), "<workspace>" // Replace <workspace> with your workspace name. ))); SdkTracerProvider sdkTracerProvider = SdkTracerProvider.builder() .addSpanProcessor(BatchSpanProcessor.builder(OtlpHttpSpanExporter.builder() .setEndpoint("<endpoint>") // Replace <endpoint> with the endpoint information obtained in Step 1. .addHeader("x-arms-license-key", "<license-key>") // Replace <license-key> with the information obtained in Step 1. .addHeader("x-arms-project", "<arms-project>") // Replace <arms-project> with the information obtained in Step 1. .addHeader("x-cms-workspace", "<workspace>") // Replace <workspace> with your workspace name. .build()).build()) .setResource(resource) .build(); OpenTelemetry openTelemetry = OpenTelemetrySdk.builder() .setTracerProvider(sdkTracerProvider) .setPropagators(ContextPropagators.create(W3CTraceContextPropagator.getInstance())) .buildAndRegisterGlobal(); tracer = openTelemetry.getTracer("OpenTelemetry Tracer", "1.0.0"); } private static Tracer tracer; public static Tracer getTracer() { return tracer; } } -
Create a Span.
import io.opentelemetry.api.trace.Span; import io.opentelemetry.api.trace.StatusCode; import io.opentelemetry.context.Scope; public class Main { public static void parentMethod() { Span span = OpenTelemetrySupport.getTracer().spanBuilder("parent span").startSpan(); try (Scope scope = span.makeCurrent()) { span.setAttribute("good", "job"); childMethod(); } catch (Throwable t) { span.setStatus(StatusCode.ERROR, "handle parent span error"); } finally { span.end(); } } public static void childMethod() { Span span = OpenTelemetrySupport.getTracer().spanBuilder("child span").startSpan(); try (Scope scope = span.makeCurrent()) { span.setAttribute("hello", "world"); } catch (Throwable t) { span.setStatus(StatusCode.ERROR, "handle child span error"); } finally { span.end(); } } public static void main(String[] args) { parentMethod(); } } -
Run the program to generate and report trace data.
Automatic and manual instrumentation
You can use the Java Agent for automatic instrumentation and simultaneously use the Java SDK to add custom business instrumentation.
-
Download the Java Agent. The latest version is recommended.
-
Add the following dependencies to the Maven dependencies for manual instrumentation.
<dependency> <groupId>io.opentelemetry</groupId> <artifactId>opentelemetry-extension-annotations</artifactId> </dependency> <dependency> <groupId>io.opentelemetry</groupId> <artifactId>opentelemetry-sdk-extension-autoconfigure</artifactId> <version>1.23.0-alpha</version> </dependency>NoteThe
opentelemetry-sdk-extension-autoconfiguredependency automatically configures the SDK and passes the Java Agent configuration to the Java SDK. -
Obtain the OpenTelemetry Tracer.
When you use both the Java Agent and the Java SDK for instrumentation, you do not need to use the OpenTelemetrySupport class from the manual instrumentation section to obtain the Tracer.
OpenTelemetry openTelemetry = GlobalOpenTelemetry.get(); Tracer tracer = openTelemetry.getTracer("instrumentation-library-name", "1.0.0"); -
Modify the Controller and Service code as follows.
-
The following is the Controller code. The first and second methods shown in the code are recommended.
package com.alibaba.arms.brightroar.console.controller; import com.alibaba.arms.brightroar.console.service.UserService; import io.opentelemetry.api.GlobalOpenTelemetry; import io.opentelemetry.api.OpenTelemetry; import io.opentelemetry.api.trace.Span; import io.opentelemetry.api.trace.StatusCode; import io.opentelemetry.api.trace.Tracer; import io.opentelemetry.context.Context; import io.opentelemetry.context.Scope; import io.opentelemetry.extension.annotations.SpanAttribute; import io.opentelemetry.extension.annotations.WithSpan; import org.springframework.beans.factory.annotation.Autowired; import org.springframework.web.bind.annotation.RequestMapping; import org.springframework.web.bind.annotation.RestController; import java.util.concurrent.ExecutorService; import java.util.concurrent.Executors; /** * References: * 1. https://opentelemetry.io/docs/java/manual_instrumentation/ */ @RestController @RequestMapping("/user") public class UserController { @Autowired private UserService userService; private ExecutorService es = Executors.newFixedThreadPool(5); // Method 1: Automatic instrumentation with manually added information using the API. @RequestMapping("/async") public String async() { System.out.println("UserController.async -- " + Thread.currentThread().getId()); Span span = Span.current(); span.setAttribute("user.id", "123456"); userService.async(); child("vip"); return "async"; } // Method 2: Create instrumentation using annotations. @WithSpan private void child(@SpanAttribute("user.type") String userType) { System.out.println(userType); biz(); } // Method 3: Obtain a Tracer for purely manual instrumentation. private void biz() { Tracer tracer = GlobalOpenTelemetry.get().getTracer("tracer"); Span span = tracer.spanBuilder("biz (manual)") .setParent(Context.current().with(Span.current())) // Optional. Automatically set. .startSpan(); try (Scope scope = span.makeCurrent()) { span.setAttribute("biz-id", "111"); es.submit(new Runnable() { @Override public void run() { Span asyncSpan = tracer.spanBuilder("async") .setParent(Context.current().with(span)) .startSpan(); try { Thread.sleep(1000L); // some async jobs } catch (Throwable e) { } asyncSpan.end(); } }); Thread.sleep(1000); // fake biz logic System.out.println("biz done"); OpenTelemetry openTelemetry = GlobalOpenTelemetry.get(); openTelemetry.getPropagators(); } catch (Throwable t) { span.setStatus(StatusCode.ERROR, "handle biz error"); } finally { span.end(); } } } -
Service code:
package com.alibaba.arms.brightroar.console.service;

import org.springframework.scheduling.annotation.Async;
import org.springframework.stereotype.Service;

@Service
public class UserService {

    @Async
    public void async() {
        System.out.println("UserService.async -- " + Thread.currentThread().getId());
        System.out.println("my name is async");
        System.out.println("UserService.async -- ");
    }
}
-
-
Report trace data by modifying the VM parameters for Java startup.
Replace the placeholders in the following code with the endpoint information that you obtained in Step 1. Replace
/path/to/opentelemetry-javaagent.jarand/path/to/your/app.jarwith the actual paths to the Java Agent and your JAR package.java -javaagent:/path/to/opentelemetry-javaagent.jar \ -Dotel.resource.attributes=service.name=<service name>,acs.cms.workspace=<workspace>,service.version=<service version>,deployment.environment=<environment> \ -Dotel.exporter.otlp.protocol=http/protobuf \ -Dotel.exporter.otlp.traces.endpoint=<traces.endpoint> \ -Dotel.exporter.otlp.metrics.endpoint=<metrics.endpoint> \ -Dotel.exporter.otlp.headers="x-arms-license-key=<license-key>,x-arms-project=<arms-project>,x-cms-workspace=<workspace>" \ -Dotel.logs.exporter=none \ -jar /path/to/your/app.jar -
Run the program to generate and report trace data.
View monitoring data
Log on to the Cloud Monitor 2.0 console, and select a workspace. In the left navigation pane, choose .
-
On the Application List page, click the name of the application to view its monitoring details. For more information, see Application Monitoring.