Instrument your Node.js Express application with OpenTelemetry and report trace data to Cloud Monitor 2.0. After instrumentation, you can view application topology, call traces, abnormal transactions, slow transactions, and SQL analysis.
Prerequisites
-
Supported runtime environments:
-
OpenTelemetry supports Node.js v18 and later. Only Active or Maintenance Long-Term Support (LTS) versions are officially supported. Earlier or non-LTS versions might work but are not tested or guaranteed.
-
For more information about version compatibility, see Supported Runtimes.
-
-
Supported libraries and frameworks: Many popular Node.js libraries support automatic instrumentation. For a complete list, see Supported instrumentations.
Step 1: Get endpoint information
Log on to the Cloud Monitor 2.0 console, and select a workspace. In the left navigation pane, click Integration Center.
-
In the Server-side Application section, click the Node.js card, and then select OpenTelemetry as the Instrumentation Type.
-
In the Parameter Configuration section, next to LicenseKey, click Click to get. Select the Instrumentation Type, Connection Type, and Export Protocol. Then, enter the Service Name, Version, and Environment.
The page generates the required integration code based on your configuration, including the endpoint URL and LicenseKey.
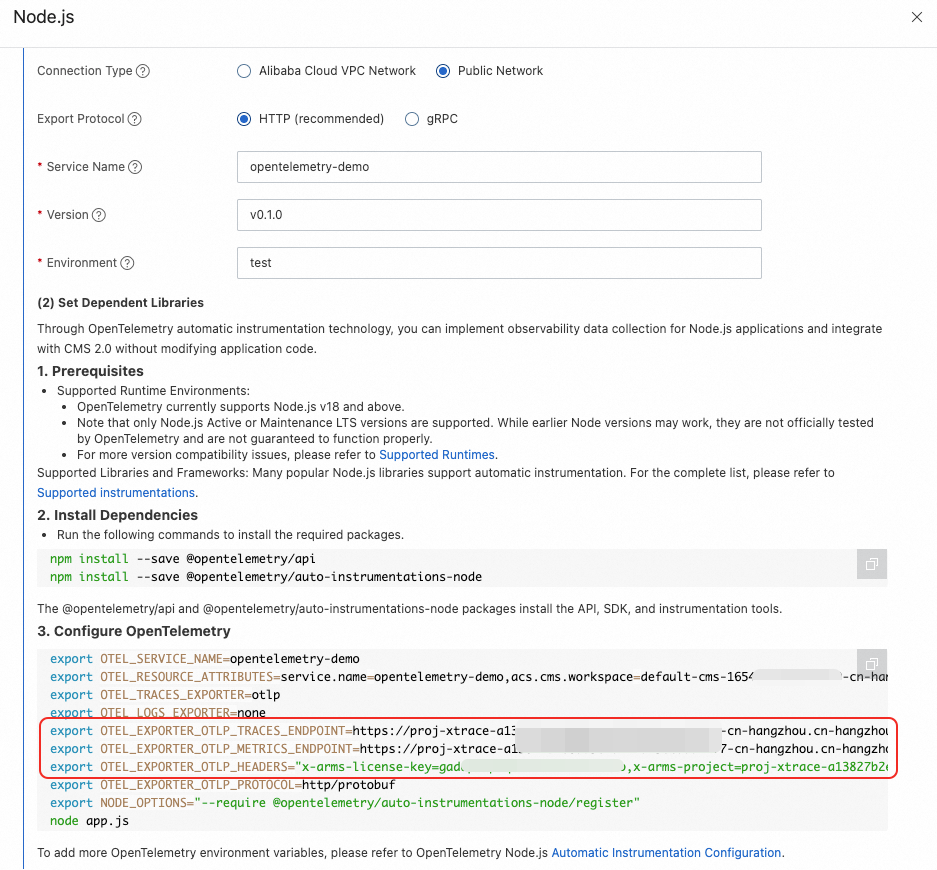
Set up dependencies
Automatic instrumentation (recommended)
-
Install the dependency packages.
The @opentelemetry/api and @opentelemetry/auto-instrumentations-node packages provide the APIs, SDKs, and instrumentation tools required for tracing.
npm install --save @opentelemetry/api npm install --save @opentelemetry/auto-instrumentations-node -
Set the following environment variables, and then start your application.
HTTP reporting
Replace the placeholders in the following code with the endpoint information that you obtained in Step 1.
export OTEL_SERVICE_NAME=<service name>
export OTEL_RESOURCE_ATTRIBUTES=service.name=<service name>,acs.cms.workspace=<workspace>,service.version=<service version>,deployment.environment=<environment>
export OTEL_TRACES_EXPORTER=otlp
export OTEL_LOGS_EXPORTER=none
export OTEL_EXPORTER_OTLP_TRACES_ENDPOINT=<traces.endpoint>
export OTEL_EXPORTER_OTLP_METRICS_ENDPOINT=<metrics.endpoint>
export OTEL_EXPORTER_OTLP_HEADERS="x-arms-license-key=<license-key>,x-arms-project=<arms-project>,x-cms-workspace=<workspace>"
export OTEL_EXPORTER_OTLP_PROTOCOL=http/protobuf
export NODE_OPTIONS="--require @opentelemetry/auto-instrumentations-node/register"
node app.js
gRPC reporting
Replace the placeholders in the following code with the endpoint information that you obtained in Step 1.
export OTEL_SERVICE_NAME=<service name> export OTEL_RESOURCE_ATTRIBUTES=service.name=<service name>,acs.cms.workspace=<workspace>,service.version=<service version>,deployment.environment=<environment> export OTEL_TRACES_EXPORTER=otlp export OTEL_LOGS_EXPORTER=none export OTEL_EXPORTER_OTLP_ENDPOINT=<endpoint> export OTEL_EXPORTER_OTLP_HEADERS="<license-key>,x-arms-project=<arms-project>,x-cms-workspace=<workspace>" export OTEL_EXPORTER_OTLP_PROTOCOL=grpc export OTEL_NODE_RESOURCE_DETECTORS="env,host,os" export NODE_OPTIONS="--require @opentelemetry/auto-instrumentations-node/register" node app.jsNoteTo add more OpenTelemetry environment variables, see OpenTelemetry Node.js automatic instrumentation configuration.
Manual instrumentation
-
(Optional) Create a sample application.
This step walks you through building a simple web application. Skip this step if you already have a Node.js application.
-
Create a new project directory. In the directory, run the following command to create an empty package.json file.
npm init -y -
Install the dependency package.
npm install express -
Write the application code. Create a file named app.js and add the following content.
This code simulates a dice rolling game and returns a random number from 1 to 6.
/*app.js*/ const express = require('express'); const PORT = parseInt(process.env.PORT || '8080'); const app = express(); function getRandomNumber(min, max) { return Math.floor(Math.random() * (max - min + 1) + min); } app.get('/rolldice', (req, res) => { res.send(getRandomNumber(1, 6).toString()); }); app.listen(PORT, () => { console.log(`Listening for requests on http://localhost:${PORT}`); }); -
The application is now ready. Run the following command to start the application. You can access it at
http://localhost:8080/rolldice.node app.js
-
-
Install OpenTelemetry dependencies.
Install the OpenTelemetry Node.js SDK and automatic instrumentation packages.
HTTP reporting
npm install @opentelemetry/sdk-node \
  @opentelemetry/api \
  @opentelemetry/auto-instrumentations-node \
  @opentelemetry/sdk-trace-node \
  @opentelemetry/exporter-trace-otlp-proto
gRPC reporting
npm install @opentelemetry/sdk-node \
  @opentelemetry/api \
  @opentelemetry/auto-instrumentations-node \
  @opentelemetry/sdk-trace-node \
  @opentelemetry/exporter-trace-otlp-grpc
The @opentelemetry/auto-instrumentations-node package automatically monitors common third-party libraries such as Express and generates trace data when they are called.
-
Configure OpenTelemetry.
To collect trace data from your application and send it to Cloud Monitor 2.0, create an instrumentation configuration file that initializes the SDK, configures the data exporter, and enables automatic instrumentation.
Create a file named instrumentation.js and replace the placeholders in the following code with the endpoint information you obtained in Step 1.
HTTP reporting
/*instrumentation.js*/
const opentelemetry = require('@opentelemetry/sdk-node');
const {
    getNodeAutoInstrumentations,
} = require('@opentelemetry/auto-instrumentations-node');
const {
    OTLPTraceExporter,
} = require('@opentelemetry/exporter-trace-otlp-proto');

const sdk = new opentelemetry.NodeSDK({
    traceExporter: new OTLPTraceExporter({
        url: "<endpoint>",
        headers: {
            'x-arms-license-key': '<license-key>',
            'x-arms-project': '<arms-project>',
            'x-cms-workspace': '<workspace>'
        },
    }),
    instrumentations: [getNodeAutoInstrumentations()],
});

sdk.start();
gRPC reporting
/*instrumentation.js*/ const opentelemetry = require('@opentelemetry/sdk-node'); const { getNodeAutoInstrumentations, } = require('@opentelemetry/auto-instrumentations-node'); const { OTLPTraceExporter, } = require('@opentelemetry/exporter-trace-otlp-grpc'); const sdk = new opentelemetry.NodeSDK({ traceExporter: new OTLPTraceExporter({ url: "<endpoint>", headers: { 'x-arms-license-key': '<license-key>', 'x-arms-project': '<arms-project>', 'x-cms-workspace': '<workspace>' }, }), instrumentations: [getNodeAutoInstrumentations()], }); sdk.start(); -
(Optional) Manually create a span.
Although the @opentelemetry/auto-instrumentations-node package captures most calls to common frameworks and libraries, you can manually create spans for more fine-grained tracing. This involves:
-
Get a tracer: Call getTracer to obtain a tracer instance.
-
Create and manage a span: Call startActiveSpan to create a span and end to complete it.
The following example modifies app.js to support multiple dice rolls, creating a span for each roll.
/*app.js*/ const { trace } = require('@opentelemetry/api'); const express = require('express'); const tracer = trace.getTracer('demo', '0.1.0'); const PORT = parseInt(process.env.PORT || '8080'); const app = express(); function rollOnce(min, max) { return Math.floor(Math.random() * (max - min + 1) + min); } function rollTheDice(rolls, min, max) { // Create a span return tracer.startActiveSpan('rollTheDice', (span) => { const result = []; for (let i = 0; i < rolls; i++) { result.push(rollOnce(min, max)); } // End the span span.end(); return result; }); } app.get('/rolldice', (req, res) => { const rolls = req.query.rolls ? parseInt(req.query.rolls.toString()) : NaN; if (isNaN(rolls)) { res .status(400) .send("Request parameter 'rolls' is missing or not a number."); return; } res.send(JSON.stringify(rollTheDice(rolls, 1, 6))); }); app.listen(PORT, () => { console.log(`Listening for requests on http://localhost:${PORT}`); }); -
-
Run the application.
node --require ./instrumentation.js app.js
View monitoring data
Log on to the Cloud Monitor 2.0 console, and select a workspace. In the left navigation pane, choose .
-
On the Application List page, click the name of your application to view monitoring details. For more information, see Application Monitoring.