Alibaba Cloud provides the Managed Service for OpenTelemetry service that offers developers of distributed applications various features, such as trace mapping, request statistics, and trace topology. This service helps you quickly analyze and diagnose performance bottlenecks in a distributed application architecture and improves the efficiency of development and diagnostics for microservices applications. You can install the ALB Ingress controller in Container Compute Service (ACS) clusters and enable tracing analysis to view service traces and the relevant data.
Prerequisites
-
An ACS cluster is created and Simple Log Service is enabled. For more information, see Create an ACS cluster.
-
Two vSwitches are created in different zones of the virtual private cloud (VPC) where your cluster resides. For more information, see Create and manage a vSwitch.
-
You have installed the ALB Ingress Controller add-on in the ACS cluster.
-
Connect to your ACS cluster. For more information, see Obtain the kubeconfig file of a cluster and use kubectl to connect to the cluster and Use kubectl on Cloud Shell to manage ACS clusters.
-
ActivateManaged Service for OpenTelemetry is activated.
Step 1: Obtain the ID of the Simple Log Service project
-
Log on to the ACS console. In the left navigation pane, click Clusters.
-
On the Clusters page, click the name of the target cluster. In the left navigation pane, choose Cluster Information.
-
On the Basic Information tab, find the Cluster Resources section. Copy and save the ID next to Log Service Project.
NoteIf Simple Log Service is not enabled when you create the cluster, you can manually install alibaba-log-controller to enable the service. The default project ID is
k8s-log-ACS cluster ID. For more information, see Enable the Simple Log Service component.
Step 2: Configure access logs and tracing analysis
-
Create a file named alb-test.yaml and copy the following content to the file. The file is used to create an AlbConfig Object.
apiVersion: alibabacloud.com/v1 kind: AlbConfig metadata: name: alb-demo spec: config: name: alb-test addressType: Internet # The specified vSwitches must reside in the zones supported by the current ALB instance and in the VPC of the ACS cluster. To ensure the high availability of services, select at least two vSwitches in different zones. zoneMappings: - vSwitchId: vsw-2vc82nndnoo********** # Specify the IDs of the vSwitches that are used by the ALB instance. - vSwitchId: vsw-2vc30f5mlhs********** # Specify the IDs of the vSwitches that are used by the ALB instance. accessLogConfig: logProject: k8s-log-xz92lvykqj1siwvif**** # Specify the ID of the Simple Log Service project that you obtained in Step 1. logStore: alb_test_xz92lvykqj1siwvif**** # The Logstore name must start with alb_. If the specified Logstore does not exist, the system automatically creates one. listeners: - port: 80 protocol: HTTP logConfig: accessLogRecordCustomizedHeadersEnabled: false accessLogTracingConfig: # Configure Xtrace parameters. To do this, you must first configure accessLogConfig. tracingEnabled: true # Specify whether to enable or disable the Xtrace feature. The default value is false. To enable Xtrace, set this parameter to true. tracingSample: 9999 # The sampling rate of the Xtrace feature. Valid values: 1 to 10000. This parameter takes effect only if you set tracingEnabled to true. tracingType: Zipkin # The sampling algorithm of the Xtrace feature. Set the value to Zipkin. This parameter takes effect only if you set tracingEnabled to true. -
Run the following command to create an AlbConfig:
kubectl apply -f alb-test.yamlExpected output:
albconfig.alibabacloud.com/alb-demo created -
Create a file named alb.yaml and copy the following content to the file. The file is used to create an IngressClass.
apiVersion: networking.k8s.io/v1 kind: IngressClass metadata: name: alb spec: controller: ingress.k8s.alibabacloud/alb parameters: apiGroup: alibabacloud.com kind: AlbConfig name: alb-demo -
Run the following command to create an IngressClass:
kubectl apply -f alb.yamlExpected output:
ingressclass.networking.k8s.io/alb created
After you complete the configuration, a Logstore named alb_test_xz92lvykqj1siwvif**** is created in the Simple Log Service project.
Step 3: Deploy sample services
-
Create a file named cafe-service.yaml and copy the following content to the file. The file is used to create a Deployment named coffee and a Service named coffee.
apiVersion: apps/v1 kind: Deployment metadata: name: coffee spec: replicas: 1 selector: matchLabels: app: coffee template: metadata: labels: app: coffee spec: containers: - name: coffee image: registry.cn-hangzhou.aliyuncs.com/acs-sample/nginxdemos:latest ports: - containerPort: 80 --- apiVersion: v1 kind: Service metadata: name: coffee-svc spec: ports: - port: 80 targetPort: 80 protocol: TCP selector: app: coffee type: ClusterIP -
Run the following command to deploy the Deployment and Service:
kubectl apply -f cafe-service.yamlExpected output:
deployment.apps/coffee created service/coffee-svc created -
Create a file named cafe-ingress.yaml and copy the following content to the file. The file is used to configure forwarding rules for the ALB Ingress to expose the Service.
apiVersion: networking.k8s.io/v1 kind: Ingress metadata: name: cafe-ingress spec: ingressClassName: alb rules: - host: demo.domain.ingress.top http: paths: # Configure a context path. - path: /coffee pathType: ImplementationSpecific backend: service: name: coffee-svc port: number: 80 -
Run the following command to configure the publicly-accessible domain name and path of the coffee Service:
kubectl apply -f cafe-ingress.yamlExpected output:
ingress.networking.k8s.io/cafe-ingress created -
(Optional) If you set the
spec.rules.hostparameter to a custom domain name when you create the Ingress, you must add a CNAME record to map the domain name to the domain name of the ALB instance. Then, you can access the Services by using the custom domain name. For more information, see Configure a custom domain name.
Step 4: View tracing data
-
Run the following command to obtain the address of the ALB instance (ADDRESS):
kubectl get ingressExpected output:
NAME CLASS HOSTS ADDRESS PORTS AGE cafe-ingress alb demo.domain.ingress.top alb-u53i28ewt580*****.cn-<Region>.alb.aliyuncs.com 80 16m -
Run the following command to access the Service:
curl -H Host:demo.domain.ingress.top http://alb-u53i28ewt580*****.cn-<Region>.alb.aliyuncs.com/coffeeNoteThe expected output is an HTML page with the title
Hello World. Access the domain name from your web browser. The following page is displayed.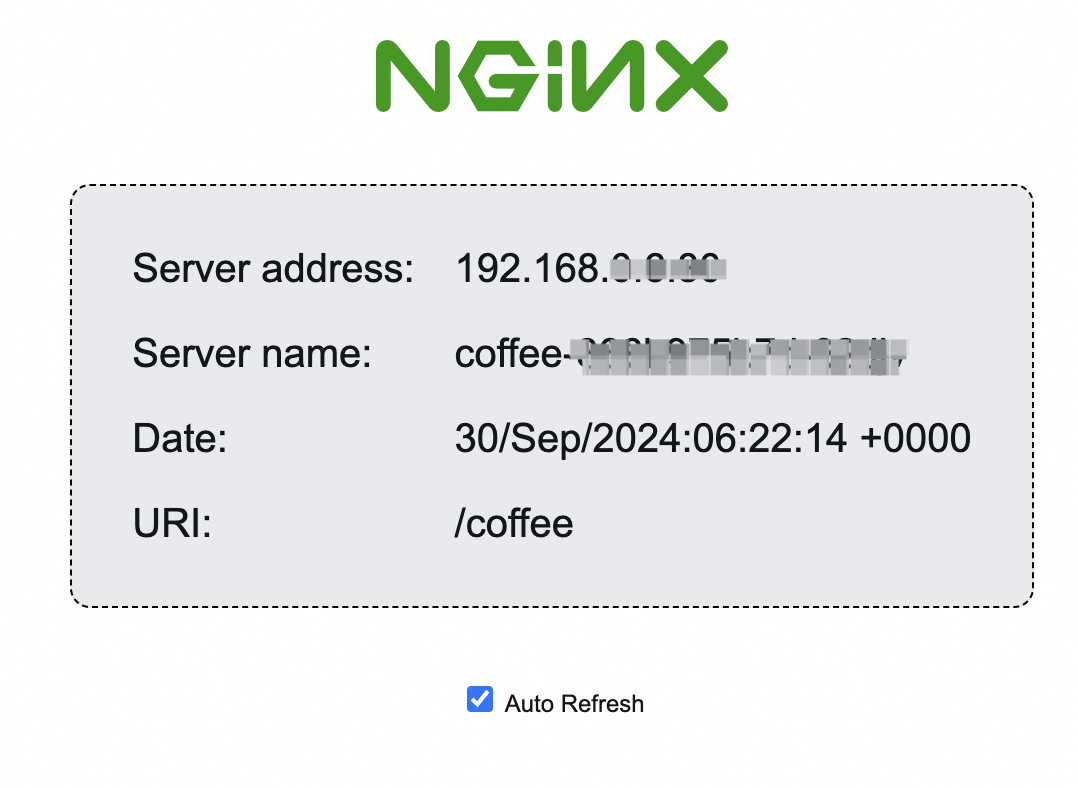
-
Check the access log of the ALB instance in Simple Log Service. Make sure that the preceding service access operation is logged and the Xtrace fields can be found.
-
Log on to the Simple Log Service console.
-
In the Projects area, select the Simple Log Service project that corresponds to the ACK cluster (the default project is
k8s-log-<your-cluster-ID>) and then click the Logstores tab. -
Click the Logstore whose name starts with
alb_(alb_test_xz92lvykqj1siwvif****in this example) and search forcoffee.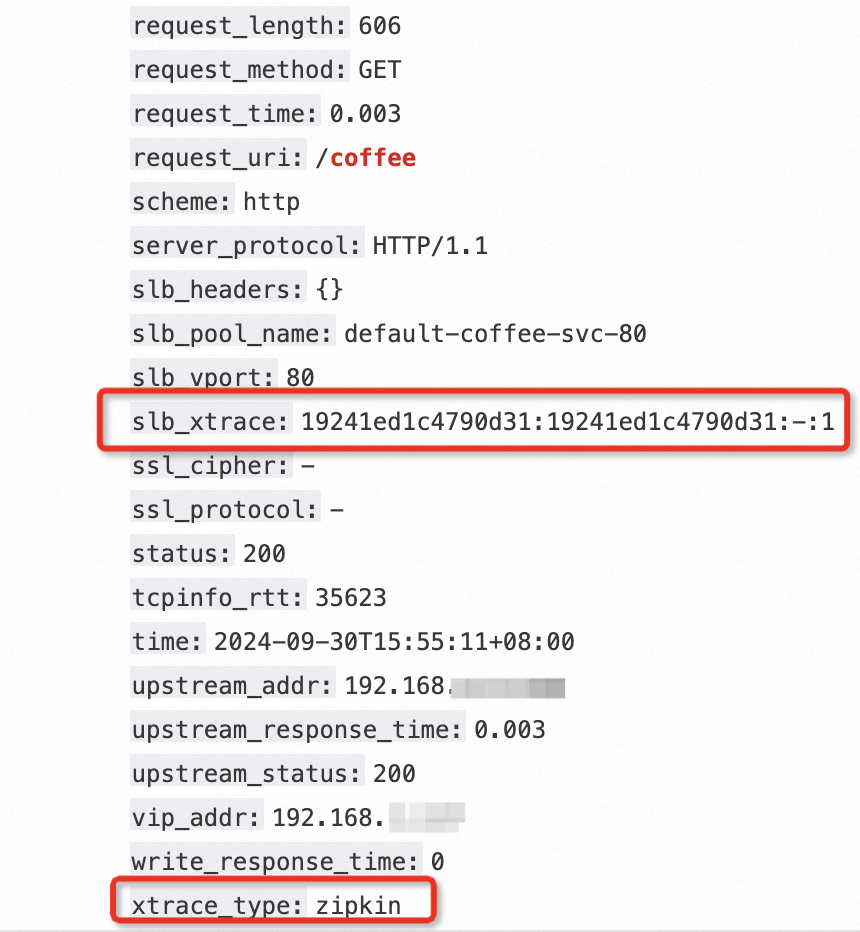
Check whether the following Xtrace fields can be found:
-
slb_xtrace:
19241ed1c4790d31inslb_xtrace: 19241ed1c4790d31:19241ed1c4790d31:-:1is the trace ID of the request. The trace ID can be used in tracing analysis as a query condition. -
xtrace_type:
xtrace_type: zipkinindicates the sampling algorithm. For more information, see Step 2: Configure access logs and tracing analysis.
-
-
-
Use the TraceId to query trace information in Managed Service for OpenTelemetry.
-
Log on to the Managed Service for OpenTelemetry console.
-
On the Applications page, select the target region at the top, and then click the target application name. By default, the application name is the ID of the corresponding ALB instance (for example,
alb-u53i28ewt580*****). -
In the left-side navigation pane, click Trace Analysis. In the search box on the right, enter the query condition
trace_id IN (19241ed1c4790d31). The TraceId19241ed1c4790d31is from the log in the previous step.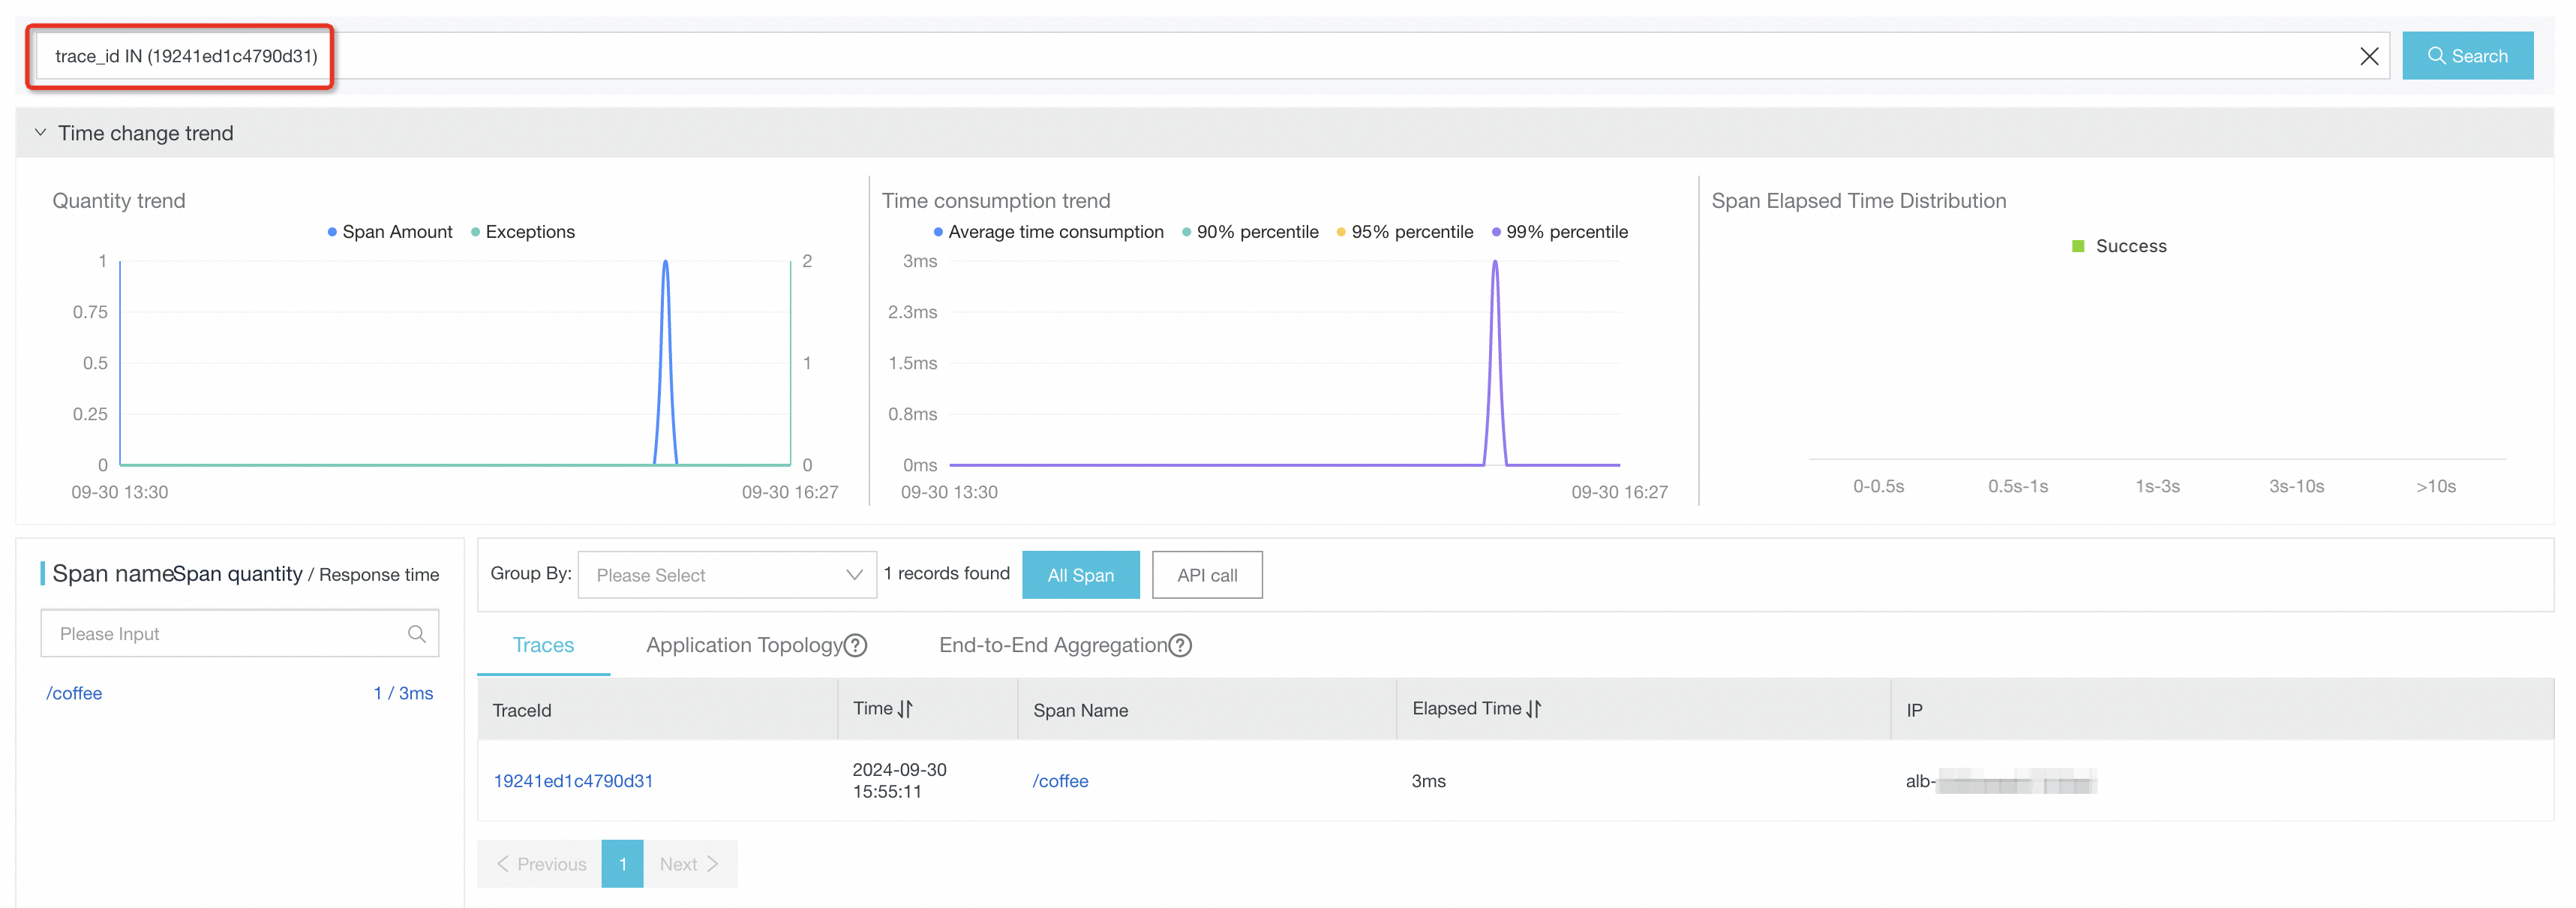
-
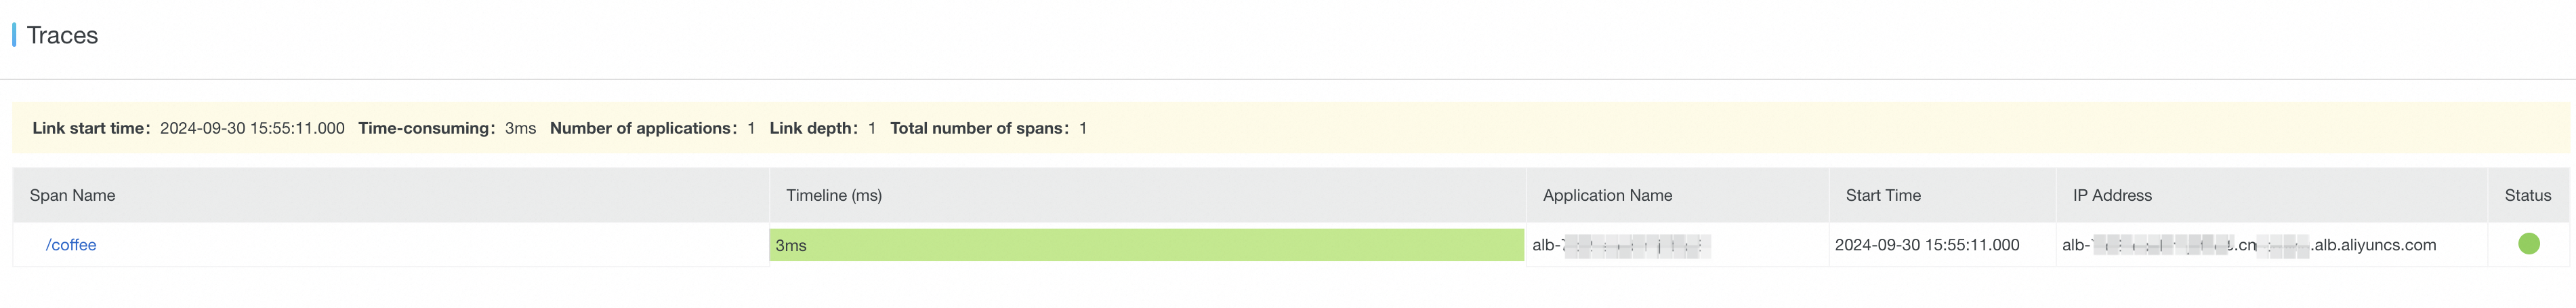
Click Search to find the trace and view the trace details generated by the request.
-
References
-
If errors occur when you use ALB, refer to the ALB documentation first. For more information, see ALB Ingress controller troubleshooting and FAQ about ALB Ingresses.