Case study analysis on the core autonomy technology
Database Autonomy Service (DAS) reduces database administration costs by up to 90% and O&M risks by 80%, freeing engineering teams to focus on business growth. This topic uses Double 11 case studies to walk through five core autonomy capabilities: 24/7 real-time anomaly detection, automatic fault recovery, automatic SQL optimization, auto scaling, and intelligent stress testing.
| Capability | What it does |
|---|---|
| 24/7 real-time anomaly detection | Detects workload anomalies continuously using machine learning, across metrics, SQL queries, logs, and locks |
| Automatic fault recovery | Diagnoses root causes and initiates SQL throttling automatically, targeting a 1-5-10 recovery cycle |
| Automatic SQL optimization | Runs a closed-loop optimization process driven by global workloads, using a cost-based model instead of rule-based heuristics |
| Auto scaling | Forecasts capacity needs with time series algorithms and scales compute or storage without manual intervention |
| Intelligent stress testing | Replays actual business traffic at configurable rates to validate database capacity before peak events |
24/7 real-time anomaly detection
DAS monitors database health continuously using machine learning across hundreds of performance metrics, SQL query logs, and lock events. For each instance, DAS builds a dedicated baseline model that captures the workload's periodic patterns, trend shifts, and mean offsets—so anomaly detection adapts to your specific traffic profile rather than relying on static thresholds. Unlike threshold-based alerting, which flags problems only after service has already degraded, DAS detects deviations in near real time.
Key characteristics:
Broad scope. Detection covers metrics, SQL queries, logs, and locks—not just numeric thresholds.
Near-real-time detection. Anomalies are surfaced as they develop, before a failure occurs.
Adaptive baselines. Each instance model accounts for periodic patterns, trend shifts, and mean offsets specific to that workload.
Automatic downstream actions. When an anomaly is confirmed, DAS triggers global diagnostics, root cause analysis, and recovery or optimization workflows automatically.
Automatic fault recovery
When DAS detects an exception, it identifies the root cause, then either stops the operations causing harm or repairs the affected component—all without manual intervention.
Automatic SQL optimization
Around 80% of database performance issues are rooted in inefficient SQL. Manual SQL optimization demands deep expertise and constant attention as workloads evolve—DAS automates this process end to end.
DAS uses a cost-based model (not rule-based heuristics) to generate index recommendations and statement rewrites, quantify performance improvements, and detect bottlenecks. Recommendations are driven by global workload data—execution frequency, read/write ratios, and actual business traffic—rather than isolated query snapshots.
Double 11 case study — November 7:
The load anomaly detection feature flagged a slow SQL exception.
DAS triggered a closed-loop SQL optimization process automatically.
Optimized SQL statements were published and tracked for 24 consecutive hours to evaluate the optimization.
Auto scaling
DAS uses time series forecasting to predict capacity requirements and scale database instances automatically—adding compute, storage, or read-only nodes before performance degrades.
Key behavior: DAS detects workload anomalies through the algorithm modeling module, recommends target specifications, validates availability in the current region, and executes the scaling task—all without manual intervention.
How auto scaling works
The auto scaling pipeline consists of six modules:
| Module | Role |
|---|---|
| Performance data collection | Collects real-time metrics, active session data, and instance specifications |
| Decision center | Analyzes session and performance trends to determine whether to apply SQL throttling or trigger auto scaling |
| Algorithm modeling | Detects workload anomalies and recommends target specifications |
| Specification recommendation | Validates that recommended specifications are available in the current region and compatible with the instance's deployment type |
| Management and execution | Distributes and executes the scaling task |
| Status tracking | Measures performance before and after the specification change to evaluate the outcome |
Double 11 case study — PolarDB instance:
As business traffic increased steadily, a PolarDB instance's CPU utilization climbed to a high level. DAS detected the anomaly and automatically added 2 read-only nodes, bringing CPU utilization back down. Two hours later, traffic increased again and DAS scaled the instance from 4 CPU cores / 8 GB memory to 8 CPU cores / 16 GB memory. The instance then ran within normal parameters for more than 10 hours through the peak period.
Intelligent stress testing
Before a major traffic event or cloud migration, evaluating database capacity against synthetic benchmarks like Sysbench or TPC-C has a fundamental limitation: the SQL patterns in those tools rarely match actual business workloads. DAS stress testing replays real traffic, making the results directly applicable to production scenarios.
How intelligent stress testing works
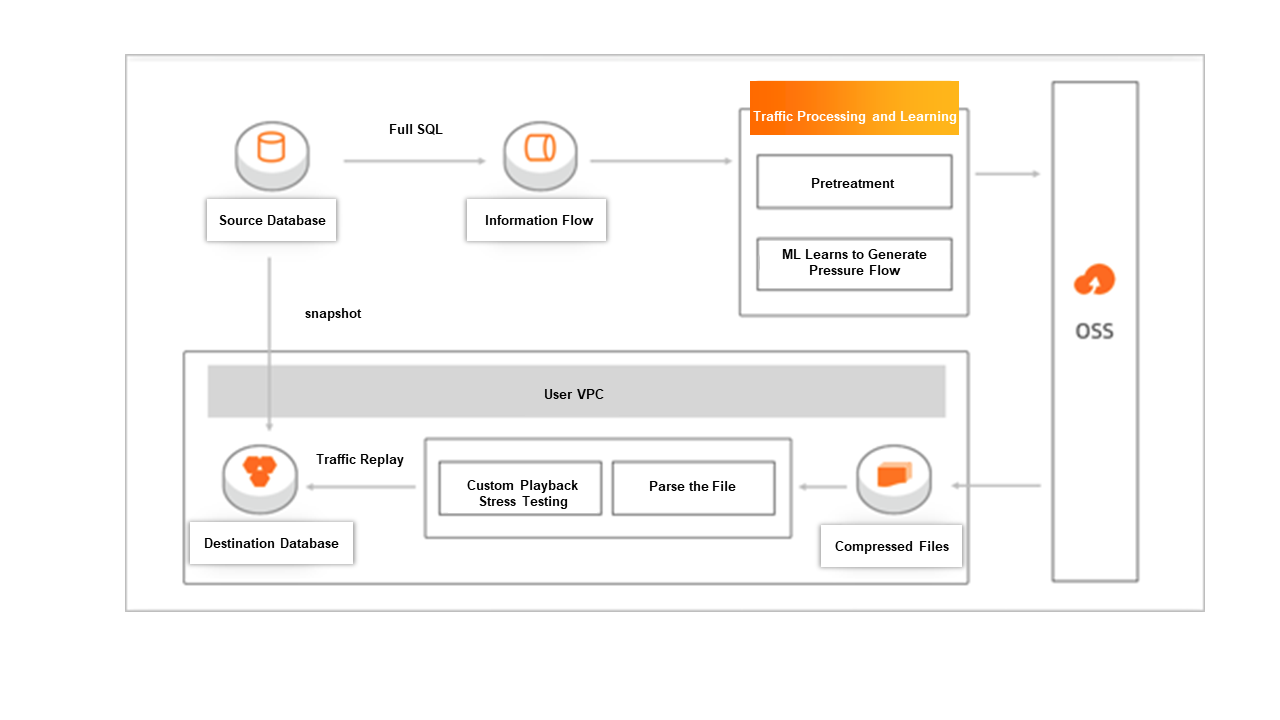
DAS learns the business workload model from historical traffic and generates realistic SQL sequences for the stress testing window. When historical data is limited, DAS synthesizes SQL statements that match the workload characteristics of your service.
Traffic playback supports concurrent thread simulation with configurable rates:
2x — double the normal rate, for pre-promotion validation
10x — ten times the normal rate, for peak stress testing
This lets teams validate database specifications and identify bottlenecks under realistic conditions, before traffic peaks arrive.