Database Autonomy Service (DAS) provides blocking statistics for ApsaraDB RDS for SQL Server instances. Use this feature to identify the sessions that cause prolonged blocking, pinpoint the root cause, and take corrective action.
Limitations
ApsaraDB RDS for SQL Server 2008 R2 with standard SSDs or Enhanced SSDs (ESSDs) is not supported.
How it works
SQL Server locks a resource when a session modifies it, preventing other concurrent sessions from accessing or modifying the same resource. In most cases, the lock is held briefly and released as soon as the session finishes. However, slow SQL statements or application errors can hold locks for extended periods, significantly reducing instance performance.
DAS samples blocking events every 10 seconds. At each sampling interval, DAS records sessions that have been executing an SQL statement for more than 2 seconds and are blocking other sessions. A single ~2-second block rarely causes noticeable performance degradation, but multiple consecutive blocking events compound and can severely impact throughput.
Uncommitted transactions hold locks indefinitely. If the Uncommited_tran value is high, the root cause is likely a session with an open, uncommitted transaction rather than a slow query.View blocking statistics
Log on to the DAS console.
In the left-side navigation pane, click Instance Monitoring.
Find the instance and click its ID to open the instance details page.
In the left-side navigation pane, click Lock Optimization. On the Lock Optimization page, click the Blocking tab.
On the Blocking tab, review the blocking sessions and their details.
Lock Blocking (Preview) tab reference
Number of blocking sessions
Displays the count of blocking sessions over recent time ranges.
Blocking trend
Displays how blocking duration has changed over a selected time range.
Hover over any point on the chart to see the details at that moment:
| Field | Description |
|---|---|
| Time | Time at which the blocking event occurred |
Processes_blocked | Number of sessions currently blocked |
Uncommited_tran | Number of open, uncommitted transactions |
| QueryHash + duration | Hash value of the blocked SQL statement and how long it has been blocked |

Blocking source details
Lists each blocking session. Click anywhere in a row to open the blocking diagram for that event.
| Column | Description |
|---|---|
| Spid | Session ID |
| QueryHash | Hash value of the SQL statement. SQL statements of the same type share the same hash value. |
| Wait Type | Reason the session is blocking another session. See sys.dm_os_wait_stats (Transact-SQL). |
| Execution Duration (ms) | Time the session spent executing the SQL statement, in milliseconds |
| SQL | SQL statement that caused the blocking event |
| Time | Time at which the blocking event occurred |
| Database Name | Database where the blocking occurred |
To copy an SQL statement, hover over the statement and click theicon that appears to its right.
Blocking diagram
Displays the blocking relationship visually: the blocking session is marked in red, and the blocked session is marked in blue.
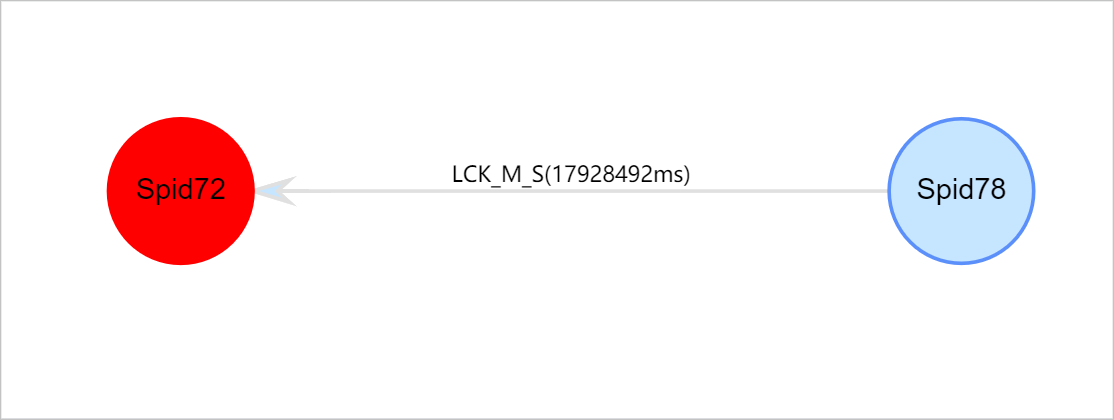
Hover over a session ID to see its full details:
| Field | Description |
|---|---|
| SPID | ID of the blocking session |
| BlockedBySpid | ID of the session being blocked |
| WaitType | Wait type in the session |
| WaitTimeMs | Duration of the blocking event, in milliseconds |
| CMD | Type of SQL statement executed in the session |
| CPU | CPU time consumed by the session, in milliseconds |
| DBName | Database on which the session runs |
| ClientAppName | Client application that initiated the session |
| HostName | Hostname of the client |
| LoginId | Username used to log on to the session |
| PhysicalIO | Physical I/O consumed by the session. Each physical I/O equals 8 KB. |
| QueryHash | Hash value of the SQL statement. SQL statements of the same type share the same hash value. |
| StartTime | Time the batch containing the SQL statement started executing. A batch can contain multiple SQL statements that share resources such as variable values. |
| Status | Status of the RDS instance |
| SQL | Click the session ID (blocking or blocked) to display the full SQL statement in the Blocking diagram section. |
SQL details
Click the ID of a blocking or blocked session in the blocking diagram to display the full SQL statement. From here, copy the statement for further analysis.