Performance Insight (original version) helps you quickly assess database load through simple charts, identify the root causes of performance issues, and improve database stability.
Supported editions
-
ApsaraDB RDS for PostgreSQL High-availability Edition
-
ApsaraDB RDS for PostgreSQL Cluster Edition
Data source
-
Performance Insight (original version) primarily collects data from pg_stat_activity.
-
Collection frequency: Data is collected every 10 s.
Procedure
Log on to the DAS console.
In the navigation pane on the left, click .
Find the target instance and click the instance ID to open the instance details page.
-
In the left-side navigation pane, click Performance Insight.
-
Click Enable Performance Insight, and in the dialog box that appears, click OK to enable Performance Insight.
NoteTo disable the Performance Insight feature, click Performance Insight on the Disable Performance Insight page.
-
On the Performance Insight page, select a time range and click Search.
NoteWhen you select a time range, the end time must be later than the start time:
-
You can use Performance Insight to view data for up to seven days within the past month.
-
You can use Average Active Sessions to view session data from the last three days.
-
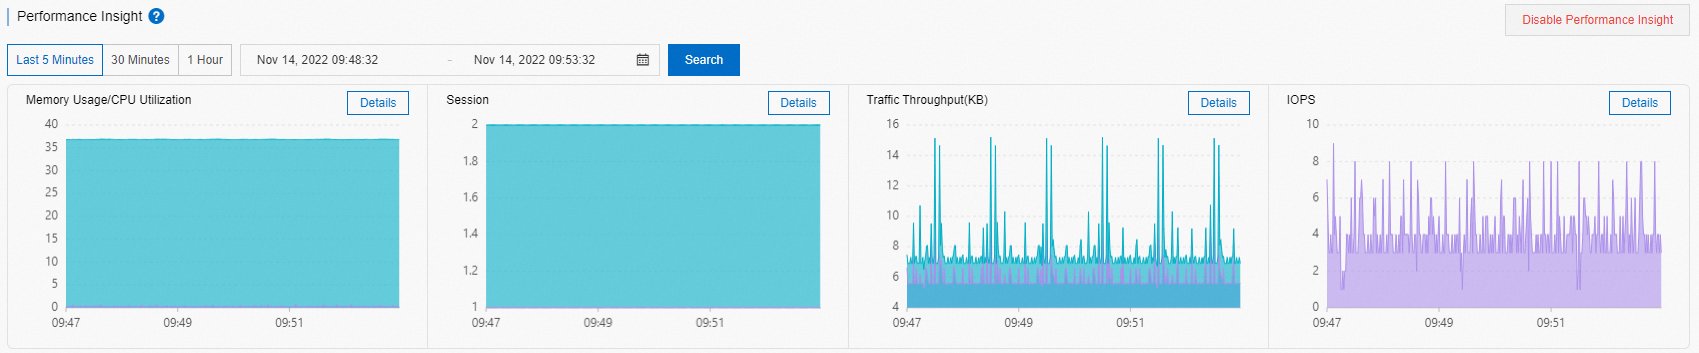
The Performance Insight area displays database performance over the selected period.
To view the details of a specific performance metric, such as Memory Usage/CPU Utilization, click Details next to the metric name.
-
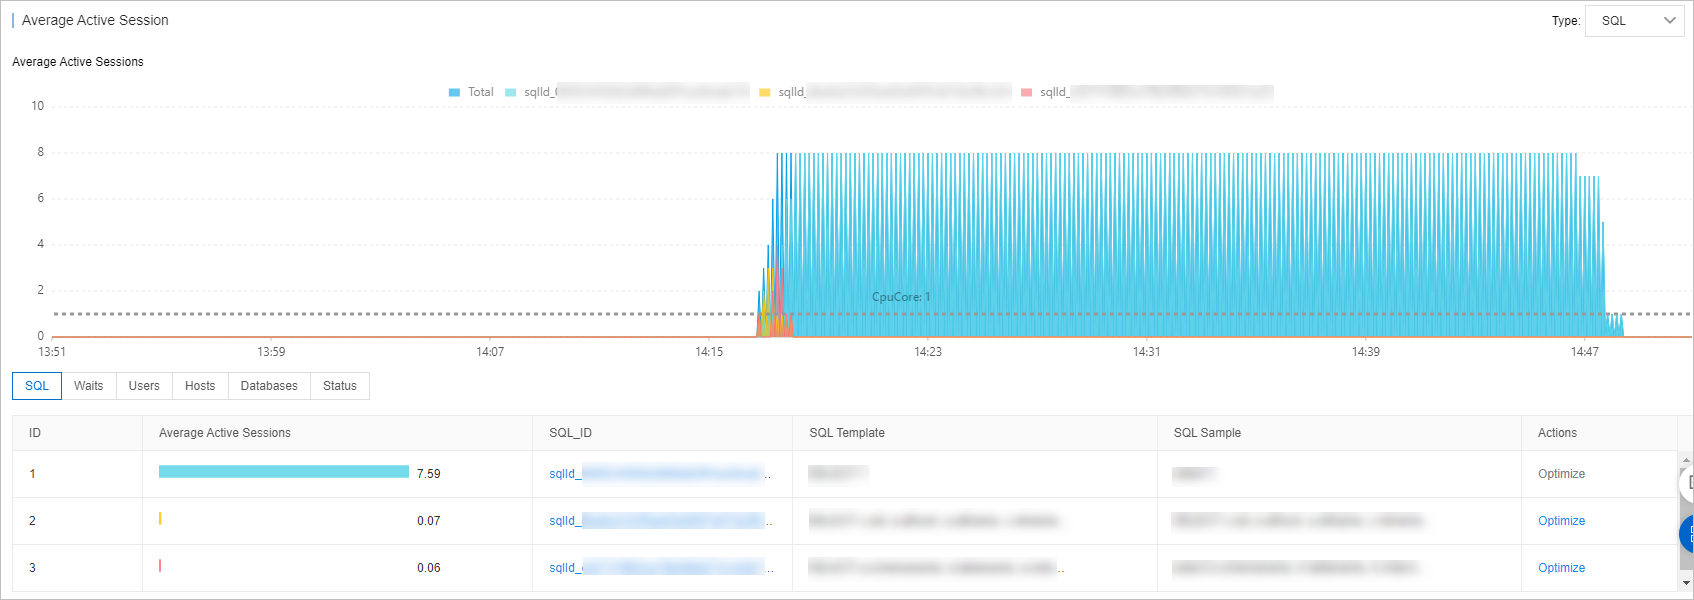
In the Average Active Sessions area, you can view trend charts for different session categories and a multi-dimensional load breakdown to identify the source of performance issues.
In the SQL category, click Optimize in the Actions column to open the SQL Diagnosis Optimization page, which displays the corresponding SQL statement, execution plan, and diagnosis result.
-