The Performance Trend feature in Database Autonomy Service (DAS) provides various performance metrics, supports custom charts, and offers powerful diagnostics capabilities. You can also manually run diagnostics for a specific time period to assess the health of your database instance.
Prerequisites
The target database instance is connected to DAS, and the connection status is Normal. For more information, see Connect an instance to DAS.
Features
The Performance Trend feature includes metrics such as Transaction Per Second (TPS), queries per second (QPS), and throughput.
The monitoring granularity, or frequency, of metrics depends on the query time range. A wider time range results in a coarser granularity.
Procedure
Log on to the DAS console.
In the navigation pane on the left, click .
Find the target instance and click the instance ID to open the instance details page.
In the navigation pane on the left, click Dashboard.
On the Performance Trends page, you can view the performance trends of metrics for the selected time period.
Click More Metrics to select the metrics whose performance trends you want to view.
NoteClick the
 icon next to a metric to view its sub-metrics.
Select an event level. If a matching event is detected, the system displays the event on the CPU Utilization trend chart.
Click an event on the trend chart to view the diagnostic results in the event details list.
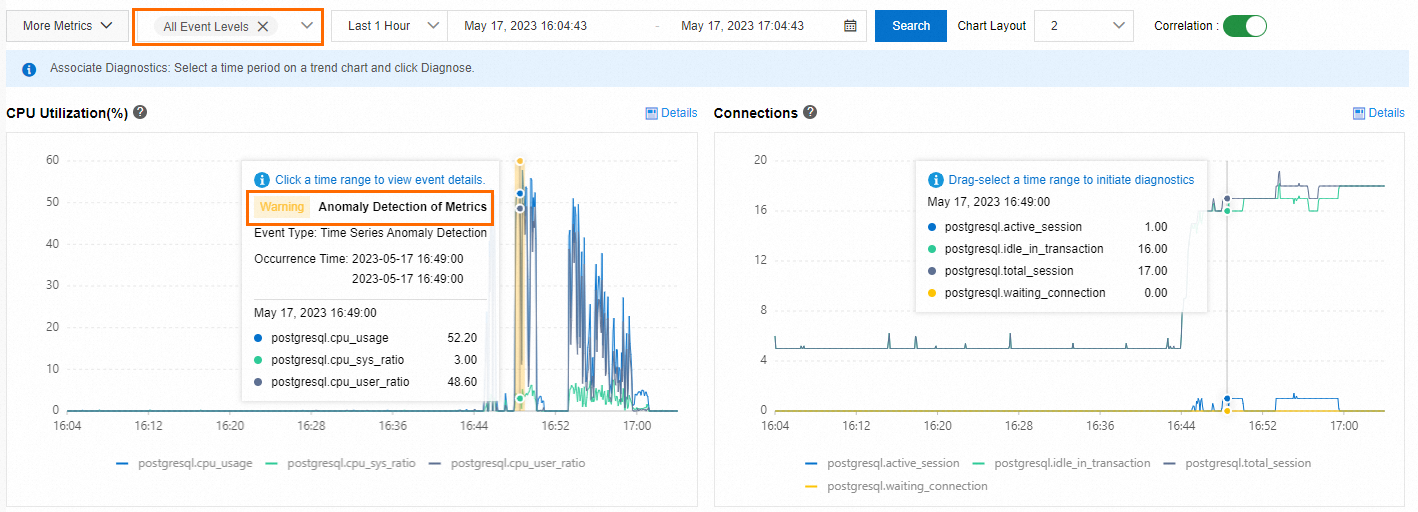
On any metric trend chart, drag to select a time period and click Diagnose.
Click Details on a metric trend chart to enlarge the chart. You can then change the time range to view the metric's trend over different periods.
On the Performance Trend Comparison page, you can compare the performance trends of the same metrics over different time ranges.
Click More Metrics to select the metrics for performance trend comparison.
On the Custom Charts page, you can create custom monitoring dashboards. You can add multiple performance metrics to the same chart for easier troubleshooting and analysis.
Click Add Monitoring Dashboard, enter a Dashboard Name, and click OK.
Click Add Node and Metrics, select the target nodes and the metrics to view, and then click the
 icon.
icon.Click OK.