Compare performance metrics between source and destination database instances to identify compatibility issues and performance bottlenecks.
Core concepts and limitations
To interpret the report accurately, you must first understand how traffic playback works and its inherent limitations.
|
Key consideration |
Description |
|
Playback dependency |
Traffic playback relies heavily on the source instance's audit log, which determines the content, concurrency, and execution order of the replayed traffic. |
|
Imperfect replication |
Due to the limited time precision of audit logs (typically to the second) and environmental differences (such as network latency and kernel scheduling), traffic playback cannot perfectly reproduce the instantaneous pressure and transaction sequences of a production environment. The playback duration may be slightly longer than the selected time range, which can affect evaluation results. |
|
Risk of SQL truncation |
The source instance's audit log has a length limit, which can cause long SQL statements to be truncated. This may lead to the following issues:
|
|
Comprehensive assessment |
Do not draw conclusions based on a single metric. Combine multiple performance dimensions from the report, including CPU utilization, QPS, latency quantiles, and SQL performance. |
Report modules
The report consists of five core modules: Overview, Performance Trend, SQL Distribution, Related SQL, and Parameter Comparison.
Overview
An executive summary comparing core playback metrics between the source and destination instances for a quick overview of the playback results.
An Important notice at the top of the page states that traffic playback depends on audit logs and cannot fully reproduce real-world online scenarios. The table below compares metrics for the source and destination instances side by side.
|
Key metric |
Interpretation and focus |
|
Time Range |
Verify that the playback time range and instance type are correct. Instance type differences are a common root cause of performance gaps. |
|
Instance Type |
|
|
CPU Utilization |
Use the core metrics CPU utilization and QPS to verify that traffic playback ran smoothly and the results are trustworthy. |
|
QPS |
|
|
Execution Time Distribution |
Compare the performance of the source and destination instances based on overall execution time distribution. |
|
SQL Template Performance Statistics |
Analyze scanned rows and execution time for each SQL template to identify compatibility issues and candidates for optimization. |
|
Parameter Differences |
Database parameter configurations significantly impact playback results. See the parameter comparison module for details. |
|
Slow SQL Statements |
The number of slow SQL statements on the source and destination instances. |
Performance trend
Time-series charts showing the trend of database performance metrics for both the source and destination instances during the playback period.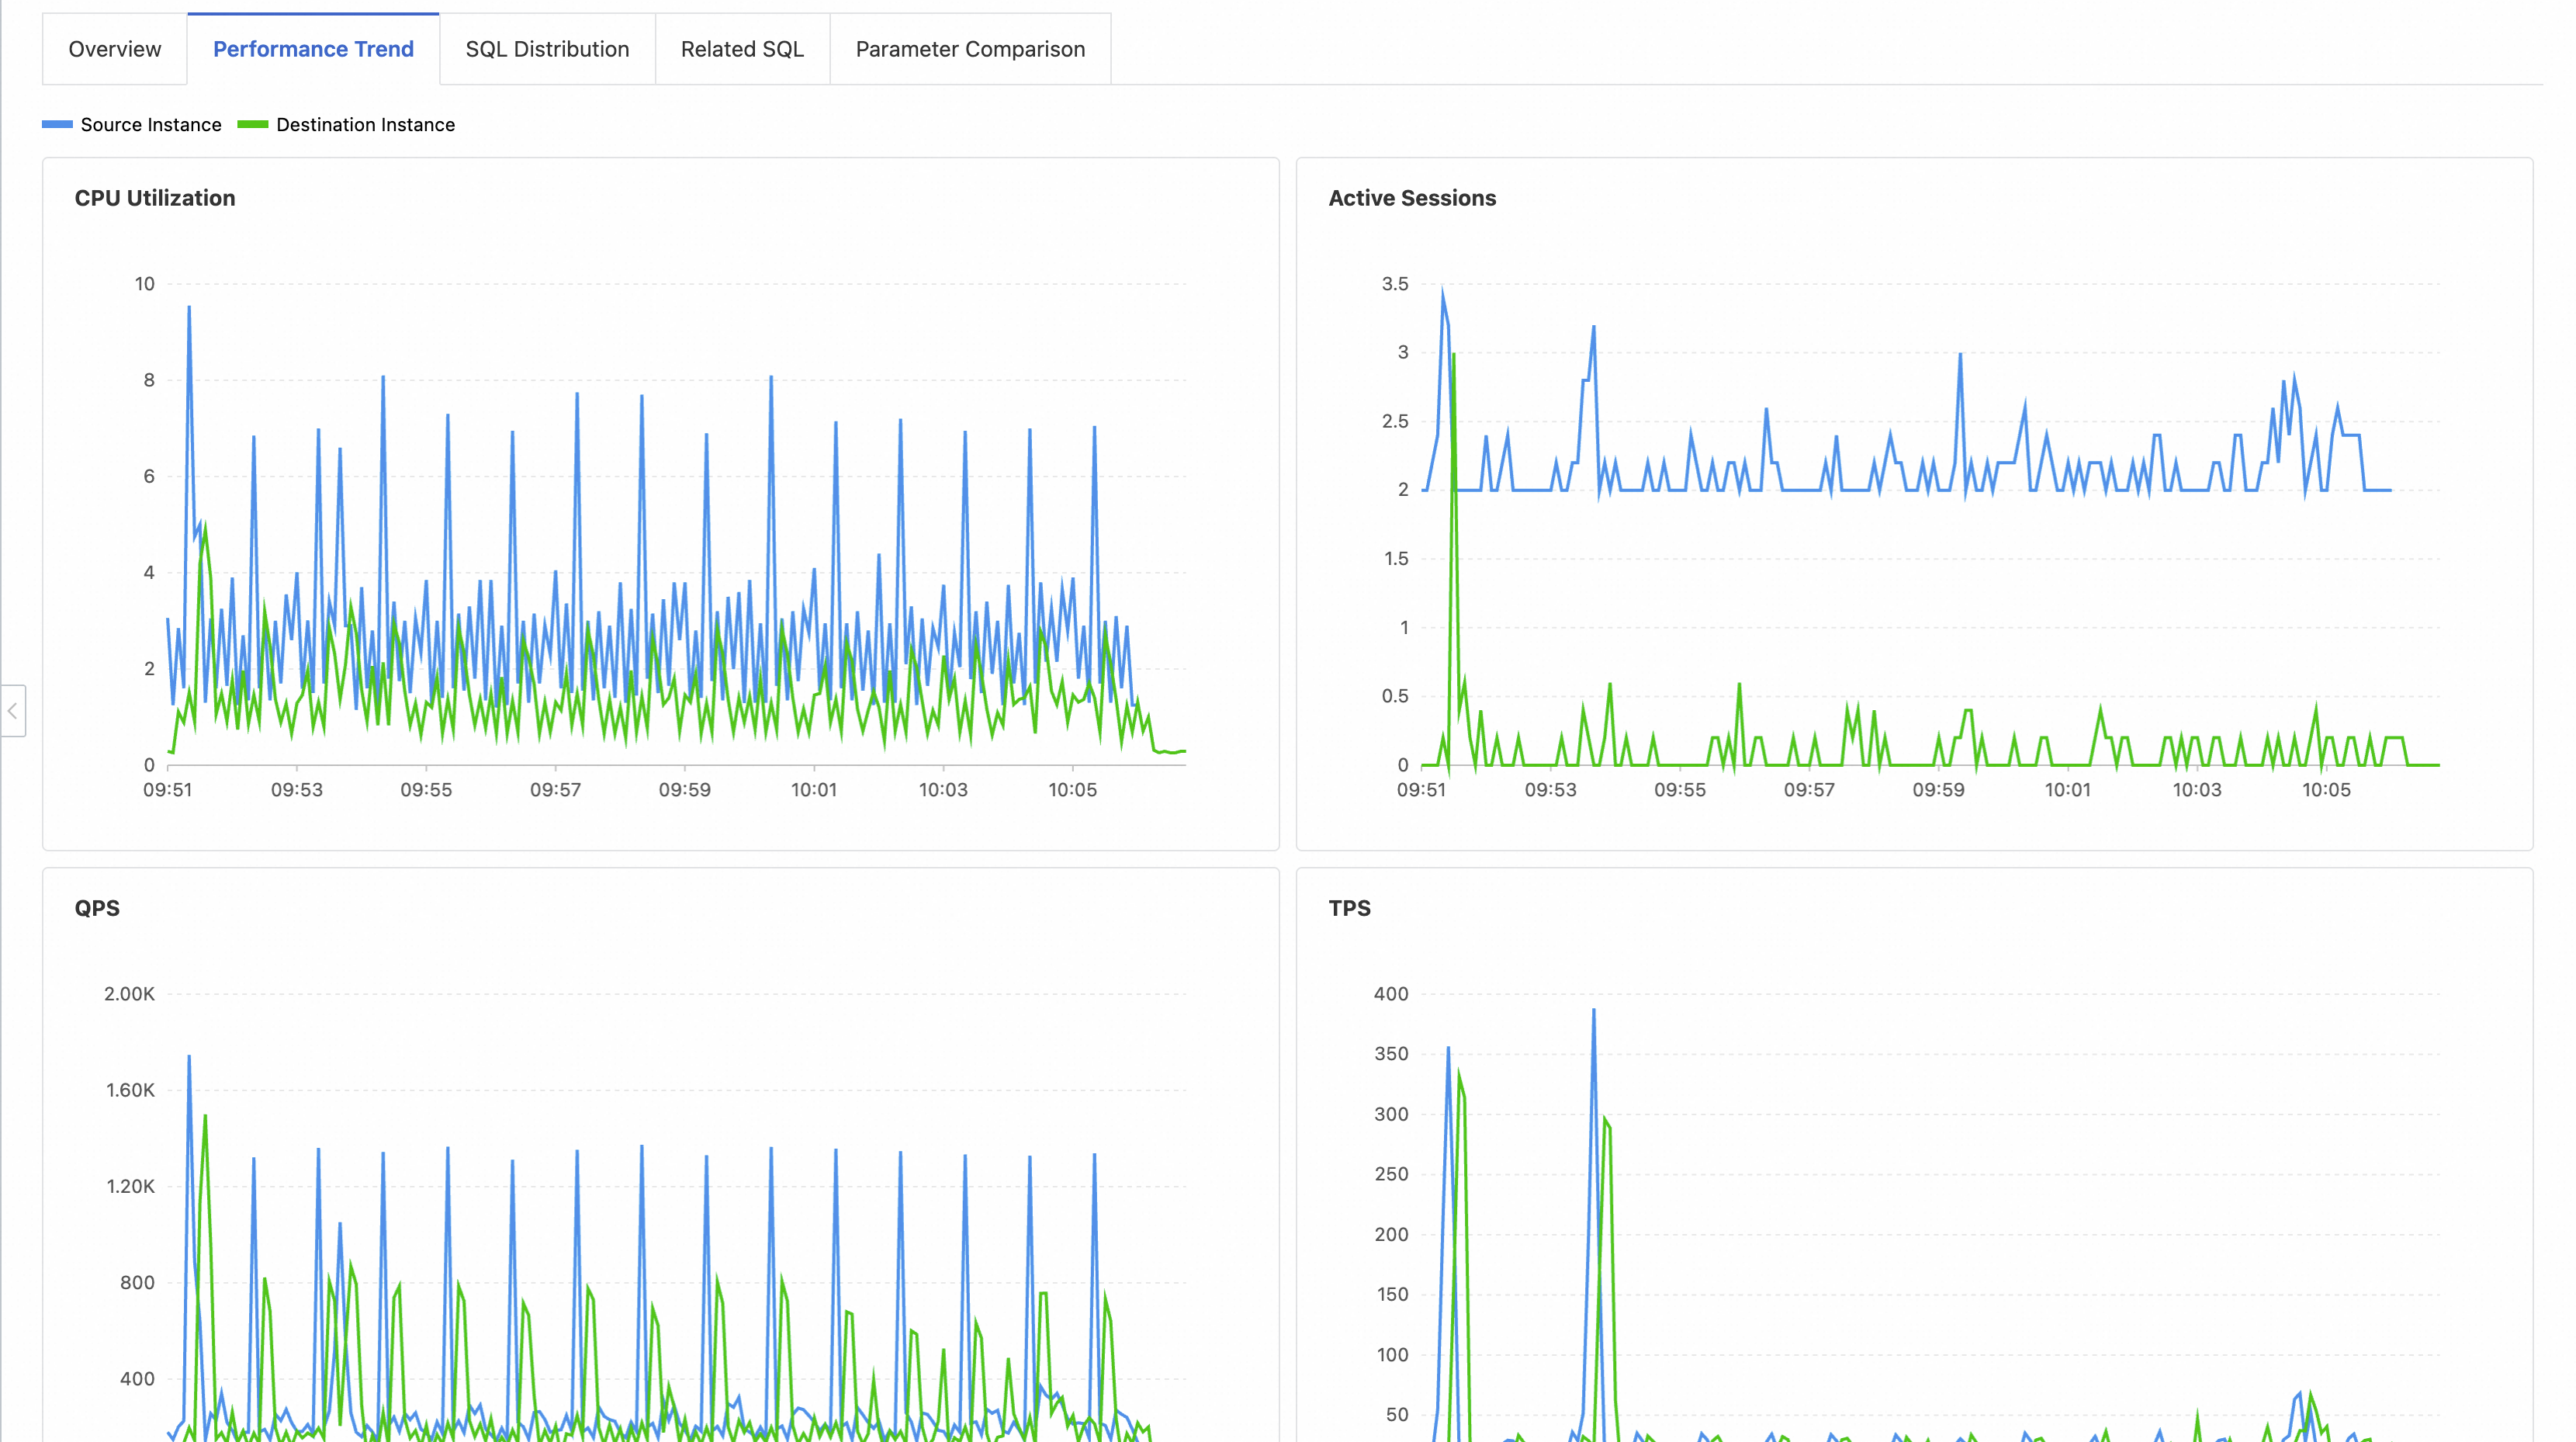
SQL distribution
A high-level view of SQL execution time distribution and errors, helping you assess the overall SQL health of the playback results.
|
Chart/List |
Interpretation and focus |
|
Execution Time Distribution |
Shows the percentage of SQL statements in each execution time bucket. Evaluate overall SQL quality and focus on SQL statements with an execution time greater than 1s, as these statements can cause instance instability. |
|
Execution Time by Quantile |
Shows execution time distribution by quantile, useful for assessing and monitoring long-tail latency and abnormal requests. |
|
Top Failed SQL Templates |
Lists the most frequently failing SQL templates. Prioritize these to prevent compatibility risks. |
|
Top Failed SQL Error Codes |
Counts error codes by failure frequency to help identify anomaly causes and confirm compatibility issues. |
Note: If the playback time is earlier than the creation time of the audit log index on the source instance, some statistics for the source instance in this module may be missing.
Related SQL
Detailed performance comparison for the top SQL templates during playback, serving as the primary basis for SQL optimization.
-
Core features:
-
Categorical statistics: All SQL templates are classified into three categories: Performance-Improved SQL, Performance-Degraded SQL, and Failed SQL. A count and a downloadable list are provided for each category.
-
Detailed data: The table lists key information for each SQL template, such as the average response time and average number of scanned rows on both the source and destination instances.
-
Failure attribution: For failed SQL statements, the error code is displayed to help you locate the cause.
-
-
Optimization workflow:
-
Start with Failed SQL: Check the error codes to resolve issues such as syntax errors, permission problems, or data inconsistencies.
-
Focus on Performance-Degraded SQL: This is the core of performance optimization. Comparing execution times and the number of scanned rows between the instances can help you quickly locate the problem (for example, a sharp increase in scanned rows due to SQL truncation).
-
Review Performance-Improved SQL: Understand why these SQL templates perform better on the destination instance. Common reasons include a newer optimizer, better parameter settings, or hardware advantages.
-
Parameter Comparison
If you find a performance gap, use this module to check for differences in database parameters.
-
Display method: All database parameters for both instances are shown side by side, with differing values highlighted.
-
Common performance-sensitive parameters:
-
Memory-related:
innodb_buffer_pool_size,join_buffer_size -
I/O-related:
innodb_flush_log_at_trx_commit,sync_binlog,innodb_read_io_threads -
Concurrency-related:
innodb_thread_concurrency,thread_handling -
Database version:
version.
-
Analysis and optimization practices
-
Move from macro to micro: Start with Overview and Performance Trend for a high-level overview, then drill down into SQL Distribution, Related SQL, and Parameter Comparison for specific SQL and configuration details.
-
Correlate across modules: Match the time points where you see performance fluctuations in Performance Trend with slow or failed SQL in SQL Distribution and Related SQL to find the root cause.
-
Verify parameter impact: If Parameter Comparison shows differences in key parameters, align the destination instance's parameters with the source instance and run traffic playback again to confirm whether the parameter difference is the root cause.
-
Focus on degradation, not absolute values: For example, a SQL template that takes 50 ms on the destination instance, up from 5 ms on the source instance, is a serious regression. Treat this as a high-priority optimization target.