Performance Insight helps you identify which SQL statements and session states are driving load on your ApsaraDB RDS for SQL Server instance. With Performance Insight, you can:
-
Monitor key performance metrics and spot load trends at a glance
-
Evaluate database load using the average active sessions (AAS) trend chart—without sifting through dozens of individual metric charts
-
Pinpoint which SQL statements, users, hosts, or databases are causing high load or latency
Limitations
ApsaraDB RDS for SQL Server instances running SQL Server 2008 R2 with standard SSDs or enhanced SSDs (ESSDs) are not supported.
Prerequisites
Before you begin, make sure you have:
-
An ApsaraDB RDS for SQL Server instance (SQL Server 2008 R2 on standard SSD or ESSD excluded)
-
Access to the DAS console
Performance Insight displays data for the last 5 minutes by default, with a default monitoring frequency of 5 minutes. At this frequency, trend charts show only a single data point. For meaningful trend visualization, change the monitoring frequency to 1 minute. See Set the monitoring frequency of an ApsaraDB RDS for SQL Server instance.
Open Performance Insight
-
Log on to the DAS console.
-
In the left-side navigation pane, click Instance Monitoring.
-
Find the instance you want to analyze, then click its instance ID.
-
In the left-side navigation pane, choose Performance Optimization > Performance Insight.
Diagnose performance issues
Use the following workflow to identify the root cause of a performance issue:
-
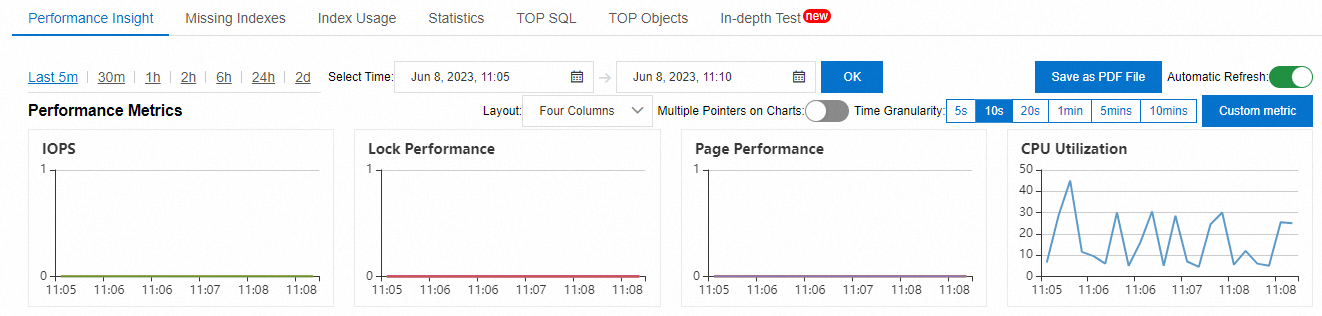
Check key metrics. Review the Performance Metric section for signs of resource pressure—sustained high CPU utilization, I/O latency spikes, or lock wait events.
-
Assess overall load. Look at the Average Active Sessions (AAS) trend chart. If AAS consistently exceeds the max Vcores value, the instance is overloaded relative to its processing capacity.
-
Identify the load source. In the Load sources from multiple dimensions section, select an AAS Type from the drop-down list in the upper-right corner of the Average Active Sessions (AAS) section to break down load by SQL statement, wait category, user, host, database, command type, or session status.
-
Narrow down the cause. Examine the top entries in the table. The AAS value for each entry tells you how many active sessions that SQL statement (or dimension) accounts for on average within the selected time range. For example, an AAS value of 0.75 for the top SQL statement means that statement held 0.75 active sessions on average.
Understand the Performance Insight tab
Performance Metric section
Displays trend charts of key metrics over the selected time range. Select or customize a time range to investigate a specific period.
Average Active Sessions (AAS) section
Displays the AAS trend chart. AAS is the average number of active sessions in the instance within a given time range. Changes in AAS directly reflect changes in database load, making it the primary metric for load assessment.
The max Vcores metric indicates the maximum number of CPU cores that can be used by the instance and determines its processing capability.
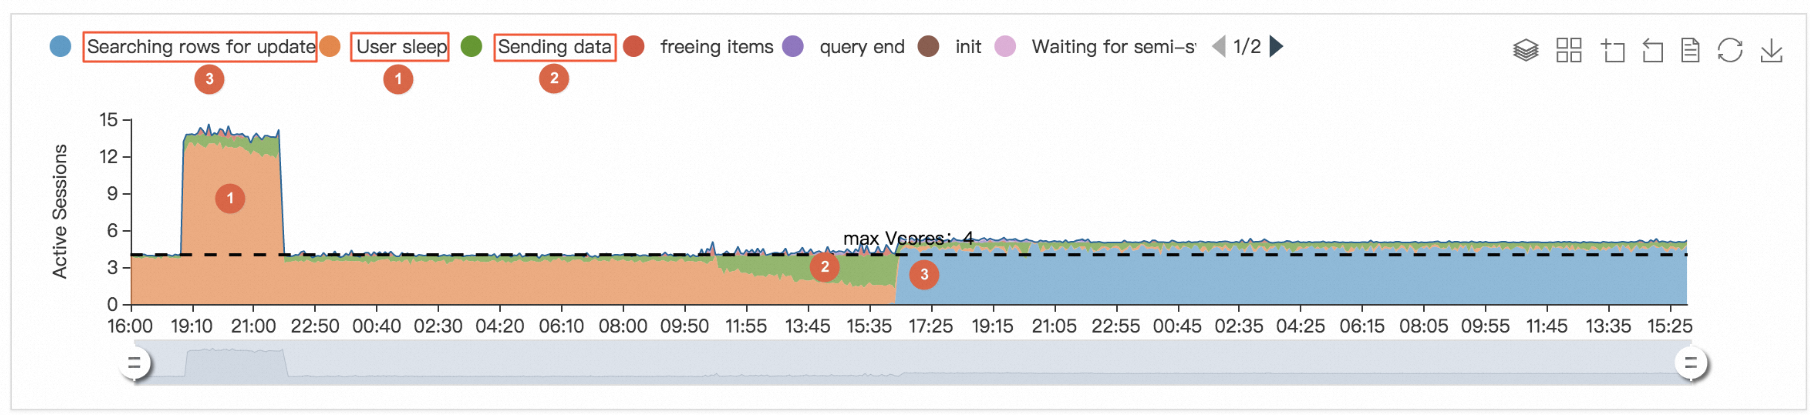
In the example above, load shifts through three stages:
-
Stage 1: All loads come from User Sleep sessions.
-
Stage 2: User Sleep sessions taper off; Sending Data sessions dominate.
-
Stage 3: Sending Data sessions decrease; Searching rows for update sessions take over.
Load sources from multiple dimensions section
Breaks down AAS by the dimension you select from the AAS Type drop-down list in the upper-right corner of the Average Active Sessions (AAS) section. Use the table to find the specific SQL statements, users, or infrastructure components responsible for high load.
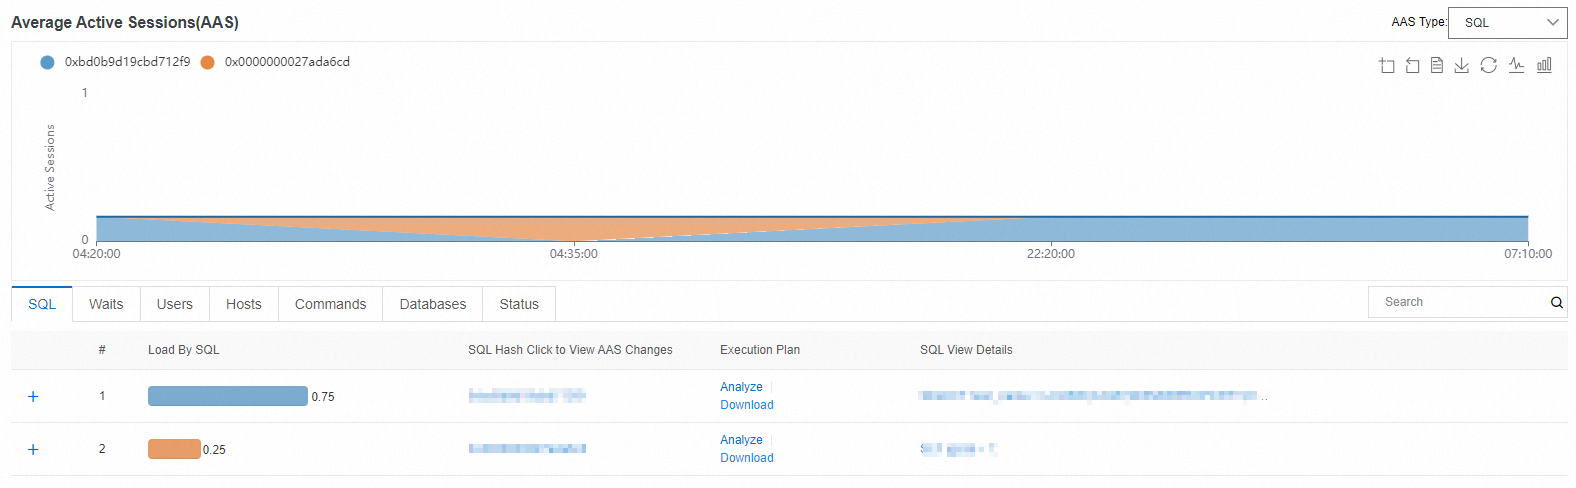
Each AAS type is suited to a different diagnostic question:
| AAS type | Use when you want to... |
|---|---|
| SQL | Find the top 10 SQL statements driving load |
| Waits | Identify which wait categories of the active sessions are blocking sessions |
| Users | See which database users are generating the most load |
| Hosts | Trace load back to specific client hostnames or IP addresses |
| Commands | Compare load across different types of SQL statements |
| Databases | Determine which databases in the instance carry the most load |
| Status | Inspect the distribution of active session statuses |