The data warehouse summary (DWS) layer is modeled based on the subject of analysis. In this layer, aggregate tables are built with a common granularity based on the metric requirements of upstream applications and products. A table in the DWS layer typically corresponds to a statistic granularity, which is a dimension or a combination of dimensions, and includes several derived metrics at that granularity.
Aggregate table design principles
- Aggregation does not cross facts. Aggregation summarizes data from the original star schema. To obtain query results that are consistent with the original model, the dimensions and measures used for aggregation must also be consistent with the original model. An atomic metric can only be defined based on a single fact table. However, you can combine atomic metrics to create composite metrics.
- Aggregation can improve query performance, but it also makes extract, transform, and load (ETL) maintenance more difficult. For example, if the primary category of a subcategory changes, existing data that is already summarized in the aggregate table must be readjusted.
In addition, you should design the DWS layer with data reusability in mind. This involves considering whether the aggregated summary can be used by other applications or teams. Consider whether an aggregation based on a specific dimension is frequently used in data analytics. If it is, you should summarize the detailed data and store it in an aggregate table.
Aggregate table specifications
- dws_report (report aggregate table)
- dws_user (user aggregate table)
Create a logical aggregate table
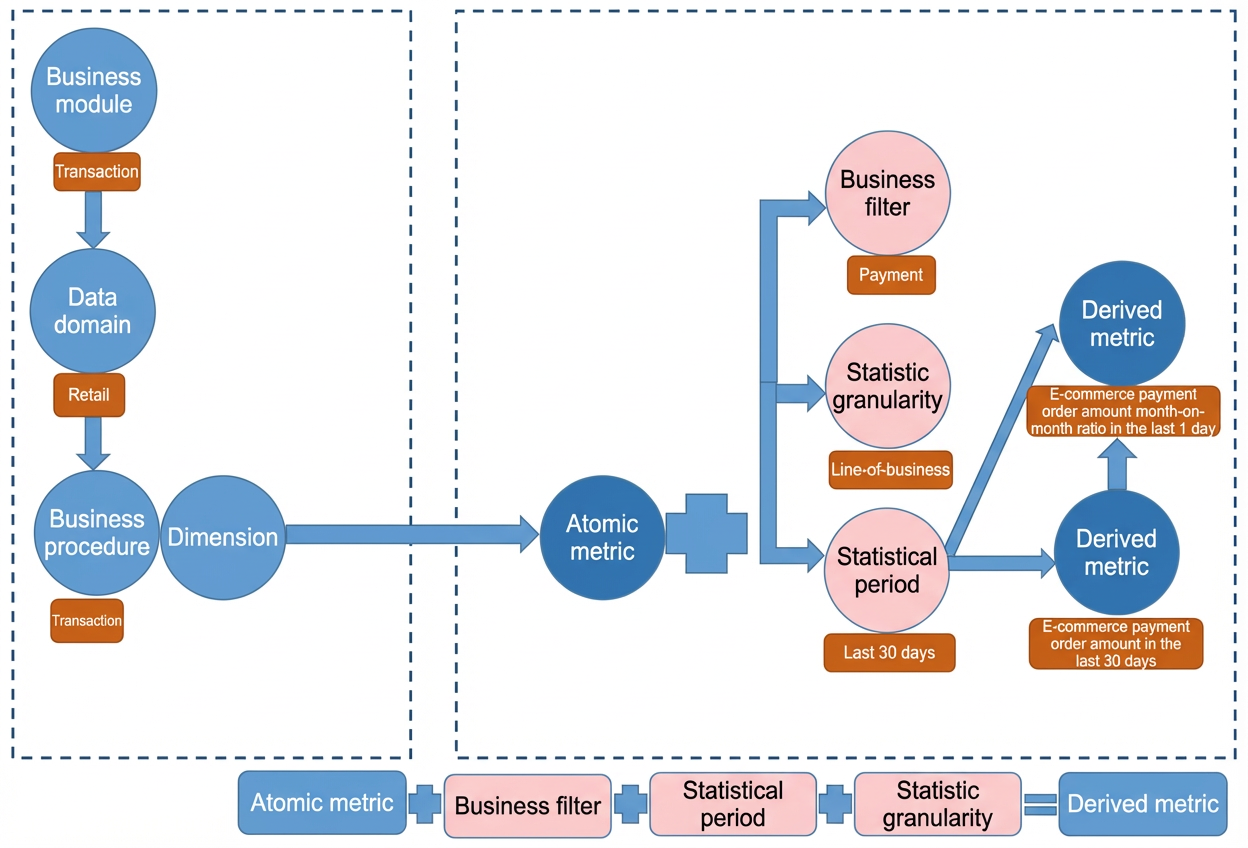
- The system performs automatic aggregation based on a consistent statistic granularity. After you submit a derived metric, the system automatically generates a new aggregate table. The following figure shows the components of a derived metric.
- You can create a logical aggregate table that uses non-derived metrics. For more information, see Add derived and composite metrics.
Query a logical aggregate table
- Logical Table Task lets you view the relationships between tasks for a logical table. For more information, see View and manage detailed aggregate table tasks.
- Logical Table Task InstancesUse the page to view the node instances that are included in a running logical table task and their statuses. For more information, see Overview of general O&M for recurring instances.