Dataphin lets you query the resource usage of your current instance so you can adjust resource specifications as needed. This topic describes how to view your resource usage in Dataphin.
Access resource statistics
Click your profile picture in the upper-right corner and select Usage Summary.
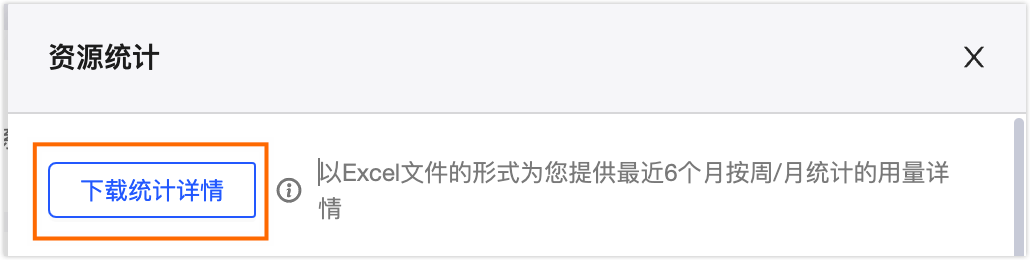
Download statistics details
Click the Download Statistics Details button to download a detailed report of your resource usage. This downloads an Excel file that contains resource statistics snapshots. These snapshots are recorded at 9:00 AM every Monday and 9:00 AM on the first day of each month for the past six months.
View resource usage
On the Sales Statistics page, you can view resource usage. To view the Statistical Method, hover over the ![]() icon to the right of the title.
icon to the right of the title.
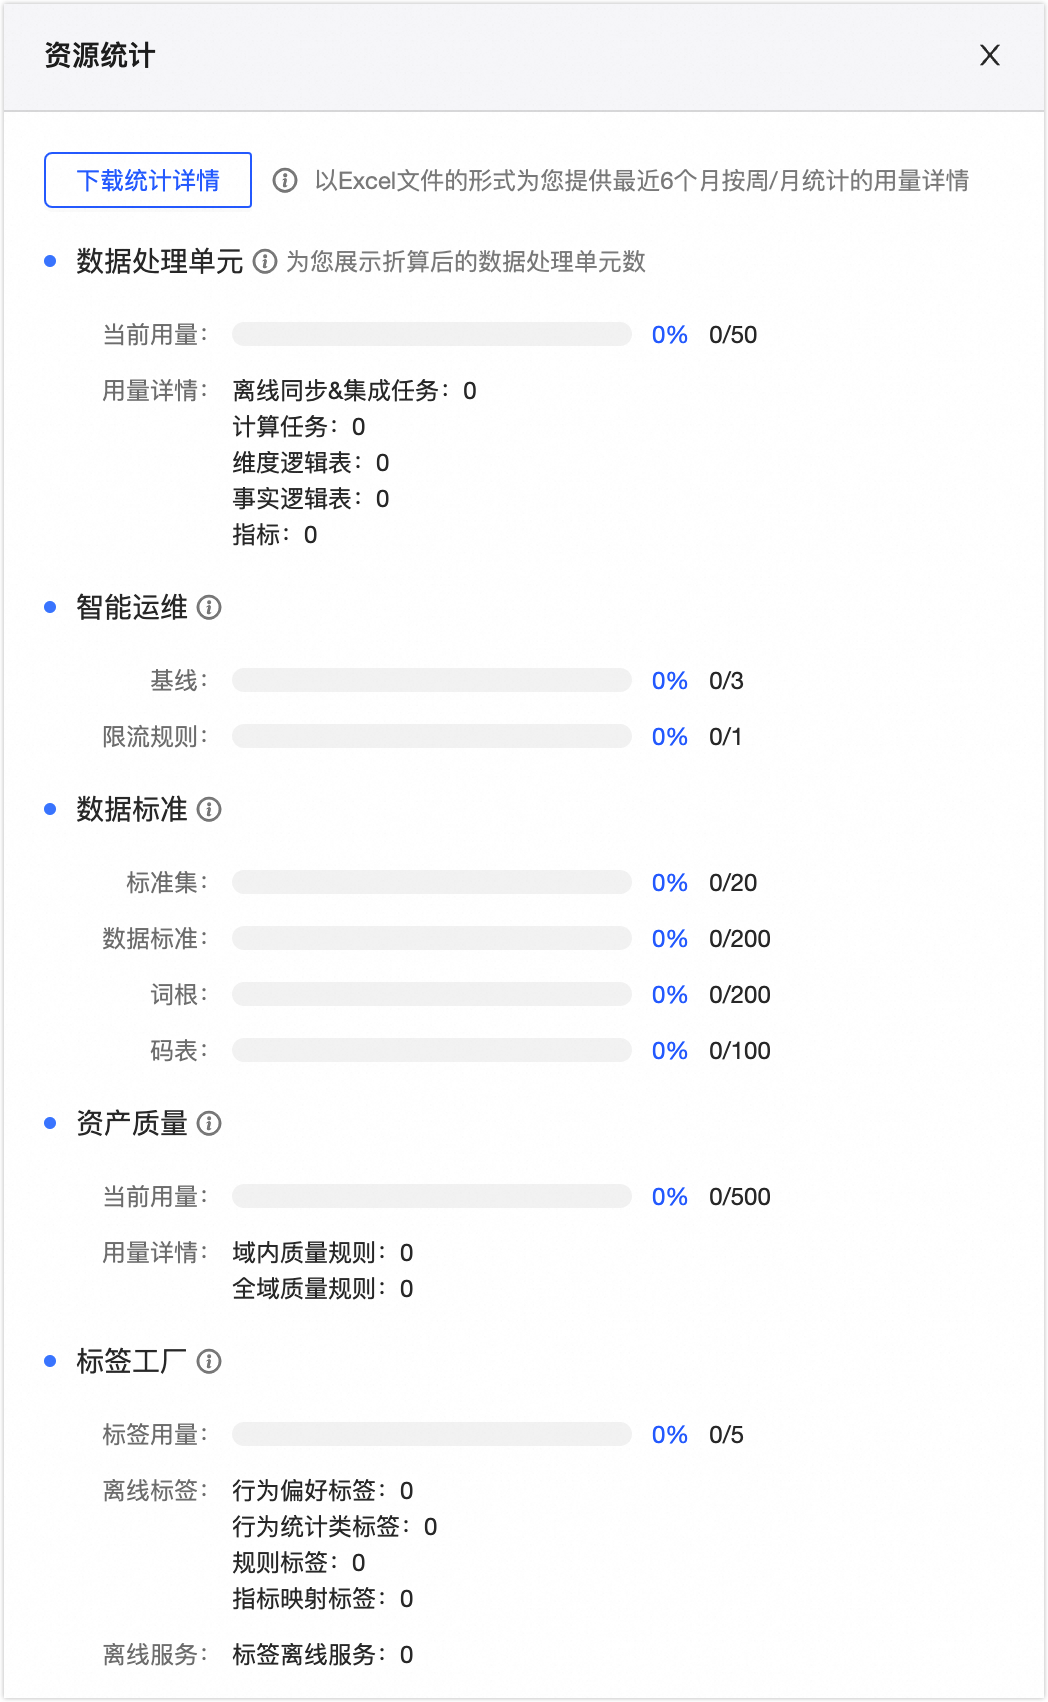
Dataphin displays the usage of your Data Processing Unit (DPU) specifications based on the features you have enabled.
If you have also purchased value-added feature packages for Dataphin, you can view the usage of the value-added features, including Intelligent O&M, Data Standard, Asset Quality, Data Service, and Tag Factory.
Resource Statistics Item |
Calculation Method |
Description |
Data processing unit |
|
Current usage: Displays the percentage of used DPUs relative to the total number of configurable DPUs for the current tenant. |
Usage details: Displays the resource usage of offline sync & integration tasks, offline computing tasks, logical dimension tables, logical fact tables, and metrics for the current tenant. For more information about DPUs, see DPU conversion logic and Billing instructions. |
||
Intelligent O&M |
Baselines: Counts all created baseline tasks, regardless of whether monitoring is enabled. The number of generated baseline instances is not limited. Throttling: Counts all created throttling rules, regardless of whether they are enabled. |
Baselines: Displays the percentage of created baselines relative to the total number of configurable baselines for the current tenant. The number of generated baseline instances is not limited. |
Throttling rules: Displays the percentage of created throttling rules relative to the total number of configurable throttling rules for the current tenant. |
||
Data Standard |
Data standard sets: Counts all created data standard sets. You can create a maximum of 200 data standard sets, with up to 100 data standards per set. Data standards: Counts all created data standards, regardless of their status. Lookup tables: Counts all created lookup tables, regardless of their status. You can create a maximum of 100 lookup tables and add up to 10,000 lookup values to each table. Roots: Counts all created roots, regardless of their status. You can create a maximum of 200 roots. |
Data standard sets: Displays the percentage of created data standard sets relative to the total number of configurable data standard sets for the current tenant. |
Data standards: Displays the percentage of created data standards relative to the total number of configurable data standards for the current tenant. |
||
Roots: Displays the percentage of created roots relative to the total number of configurable roots for the current tenant. |
||
Lookup tables: Displays the percentage of created lookup tables relative to the total number of configurable lookup tables for the current tenant. |
||
Asset Quality |
The count includes only quality rules that are enabled and active. |
Current usage: Displays the percentage of enabled and active asset quality rules relative to the total number of configurable asset quality rules for the current tenant. |
Usage details: Displays the number of enabled and active domain-specific and global quality rules for the current tenant. For more information about quality configuration rules, see Asset Quality value-added feature package billing instructions. |
||
DataService Studio |
None |
Displays the maximum queries per second (QPS) supported by the instance for the current tenant. |
Tag Factory |
|
Tag usage: Displays the percentage of published offline tags relative to the total number of configurable offline tags for the current tenant. |
Offline tags: Displays the number of published behavioral preference tags, behavioral statistics tags, rule-based tags, and metric-mapped tags for the current tenant. |
||
Offline services: Displays the number of published offline tag services for the current tenant. |
If resource usage reaches 80% or more of the total capacity, Message Center sends a notification that the resource is running low. To avoid service disruptions, upgrade the resource specifications for the feature, unpublish inactive tasks, or delete invalid configurations.