Timeliness and accuracy are the core quality metrics for data services. You can define scenarios to ensure content quality and define baselines to ensure timeliness based on the importance of your data services. When you create a baseline, you identify the nodes or assets to protect and set a commitment time for them. This ensures timely data output and prioritizes resource allocation. A baseline is a group of nodes or assets with dependencies. This group is prioritized for cluster resources and is protected by strong alert guarantees. This topic describes how to view and manage baseline instances.
Prerequisites
You have purchased the Artificial Intelligence for IT Operations (AIOps) value-added service.
Baseline instance generation time
Baseline instances for the next day are generated between 23:00 and 00:00, after the node instances are generated.
Access a baseline instance
On the Dataphin home page, click Develop in the top menu bar.
Follow the path shown in the following figure to go to the Baseline Instances page.
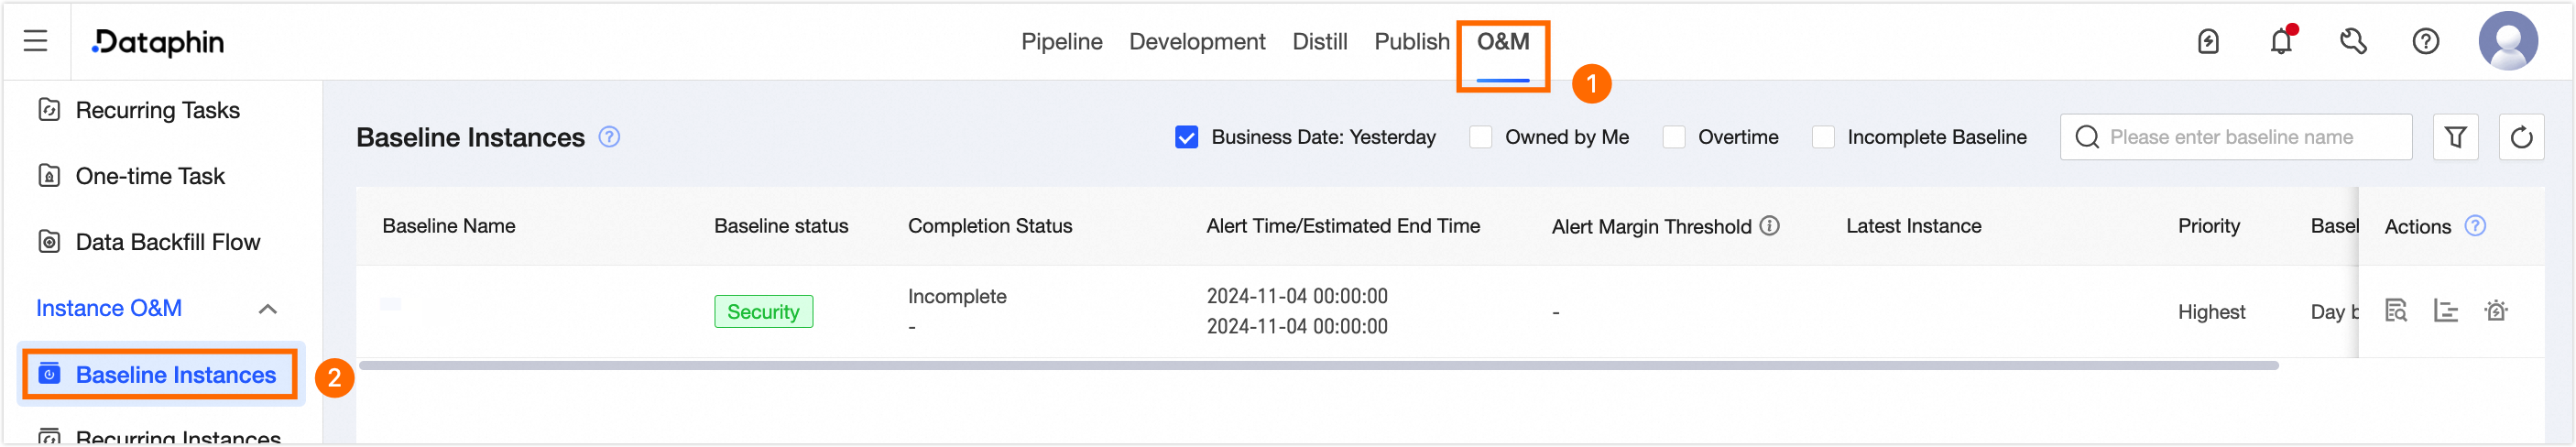
Baseline Instances page
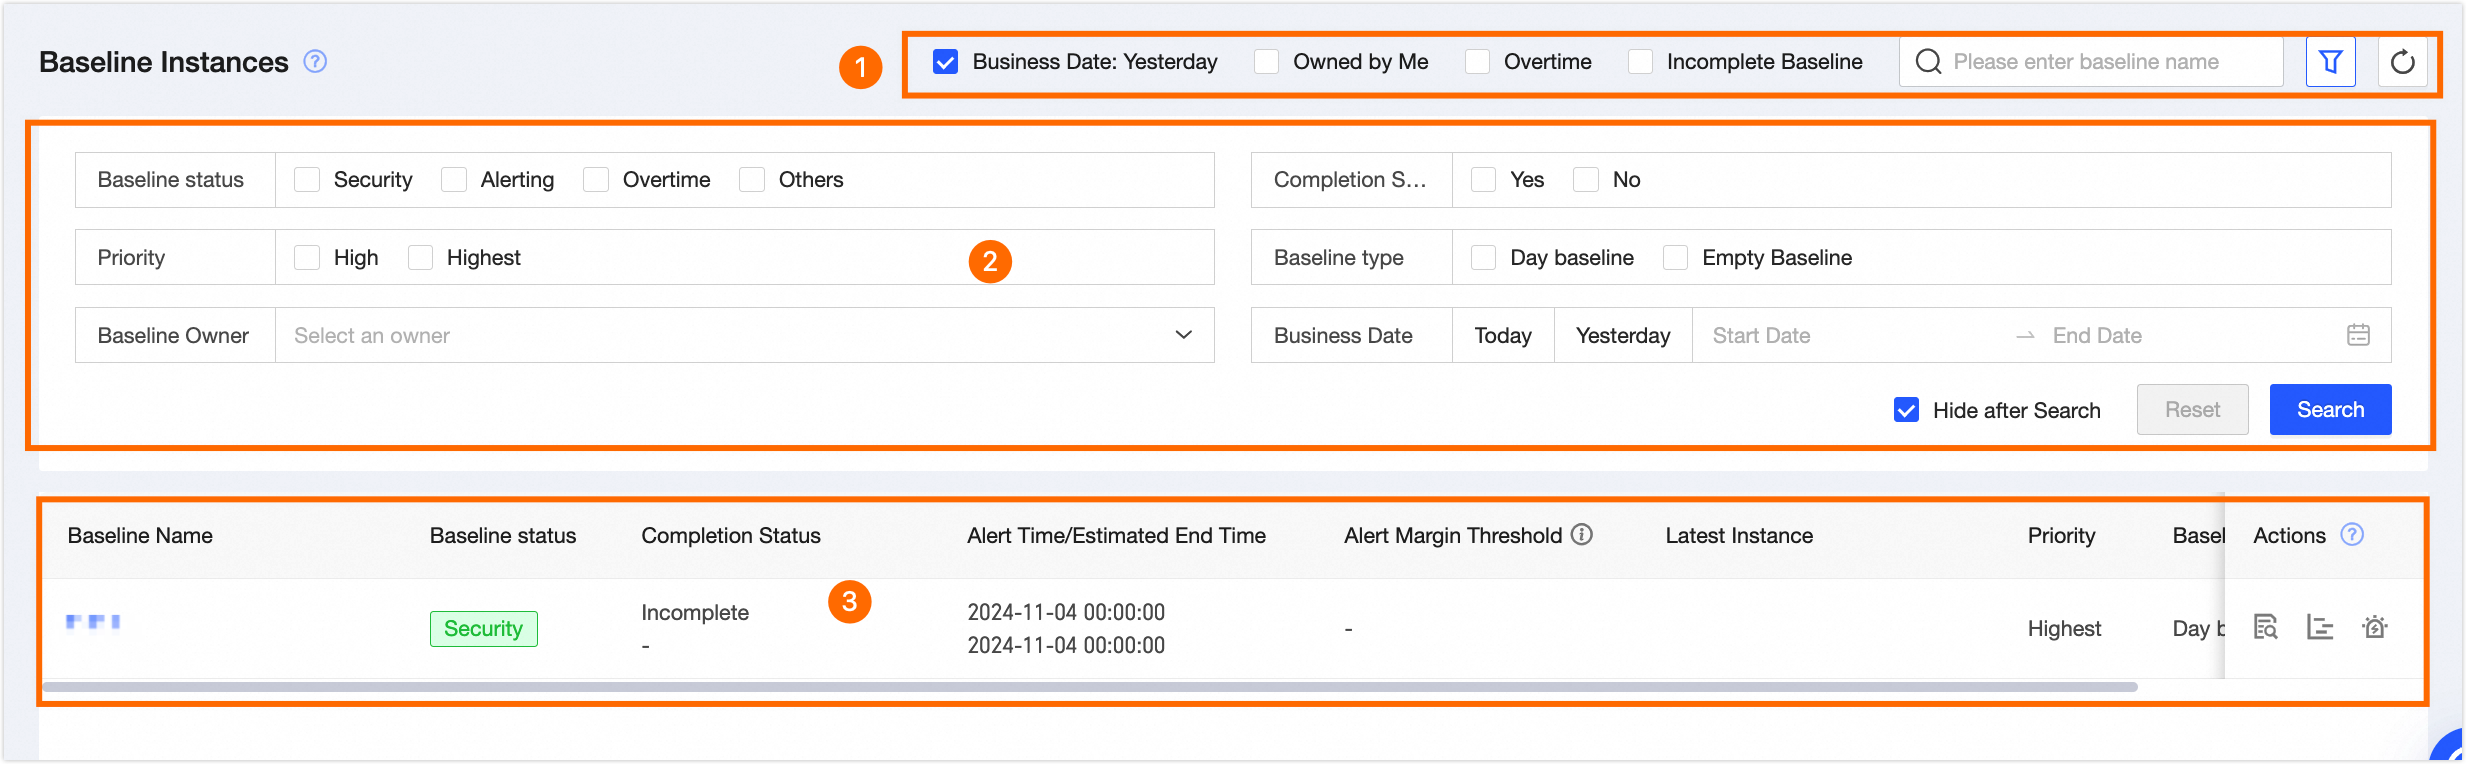
The Baseline Instances page includes a search and filter area and a list of baseline instances. On this page, you can search for and filter baseline instances, refresh the list, view details, view Gantt charts, and set alerts.
Parameter | Description |
①Search and filter area | Search for baseline instances by baseline name. You can also use quick filters: Yesterday for Data Timestamp, My baselines, Broken baselines, and Unfinished baselines.
|
②Filter area | Click
|
③Baseline instance list | Displays information about baseline instances, including Baseline Name, Baseline Status, Is Completed, Alert/Guaranteed Baseline Time, Alert Margin, Latest Instance, Priority, Baseline Type, Owner, and available operations.
|
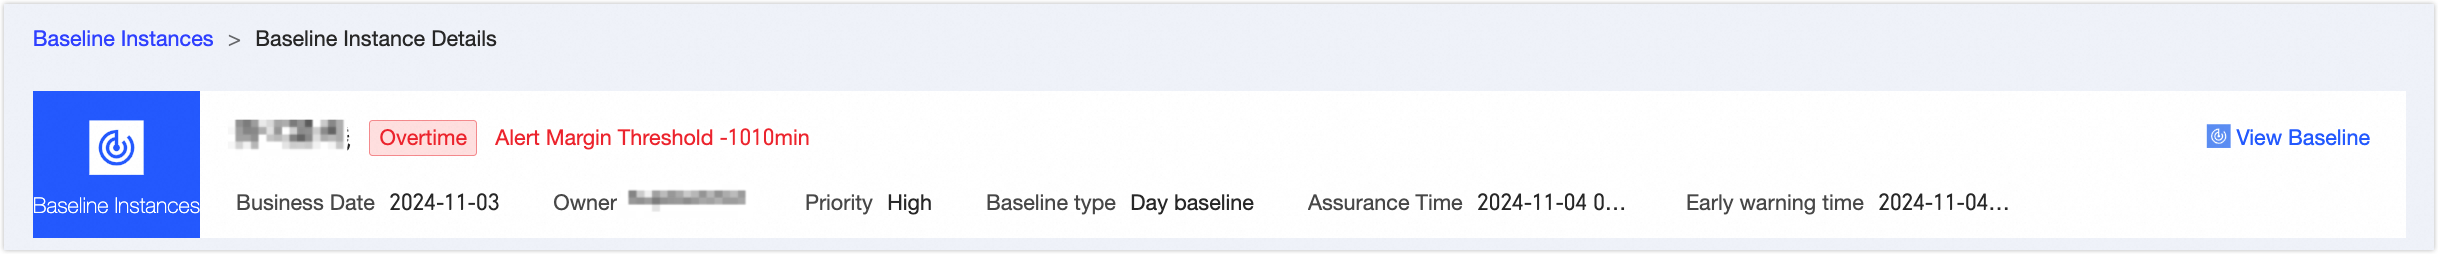
View baseline instance details
The baseline instance details page includes the following information: Basic Information, (Estimated) Latest Instance, Current Critical Instance, Critical Path, Historical Runtime Trend, and Alert Events.
Area | Description |
①Basic Information | Basic information about the baseline instance. Includes Baseline Name, Owner, Priority, Baseline Type, Guaranteed Time, and Alert Time.
|
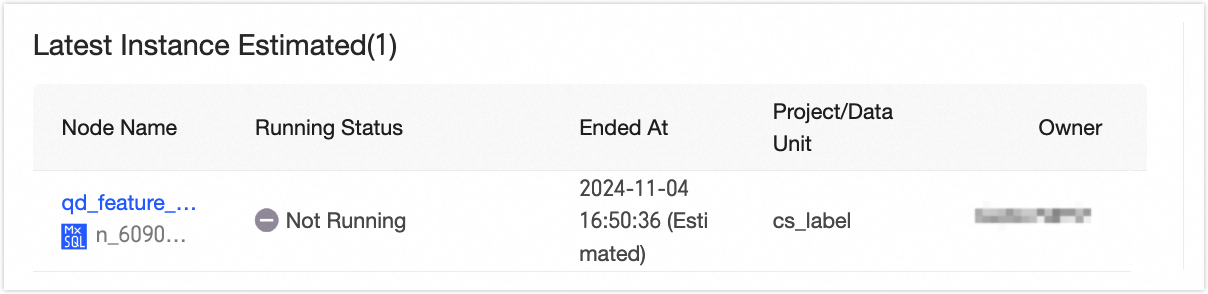
②(Estimated) Latest Instance |
The last node on the critical path. |
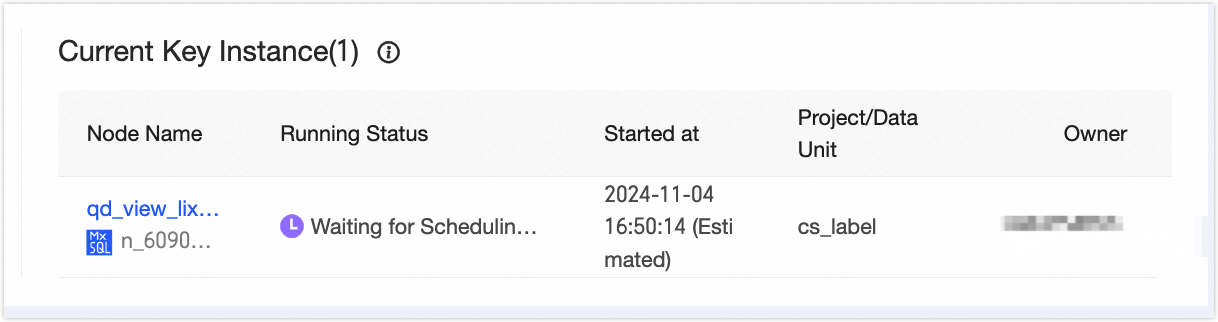
③Current Critical Instance |
The highest-level instance on the critical path that has not run successfully. |
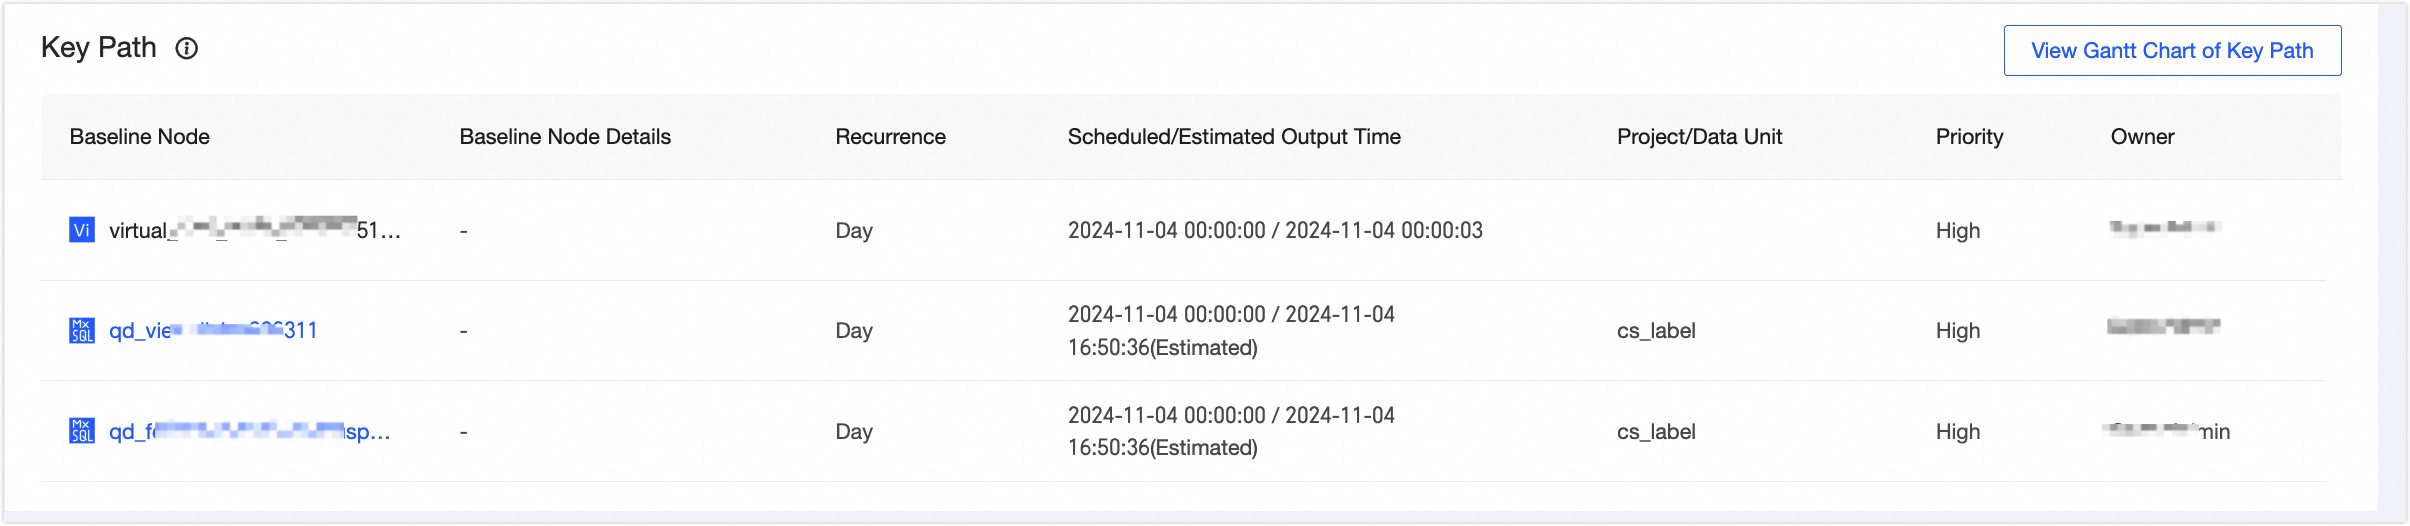
④Critical Path |
Among the multiple paths that affect the baseline's guaranteed nodes, the critical path is the one with the longest runtime. It includes the protected object name, protection details (logical table node), scheduled/estimated output time, project/module, priority, and owner. You can also click to view the critical path Gantt chart. You will be redirected to the critical path Gantt chart. For more information, see View the critical path Gantt chart. |
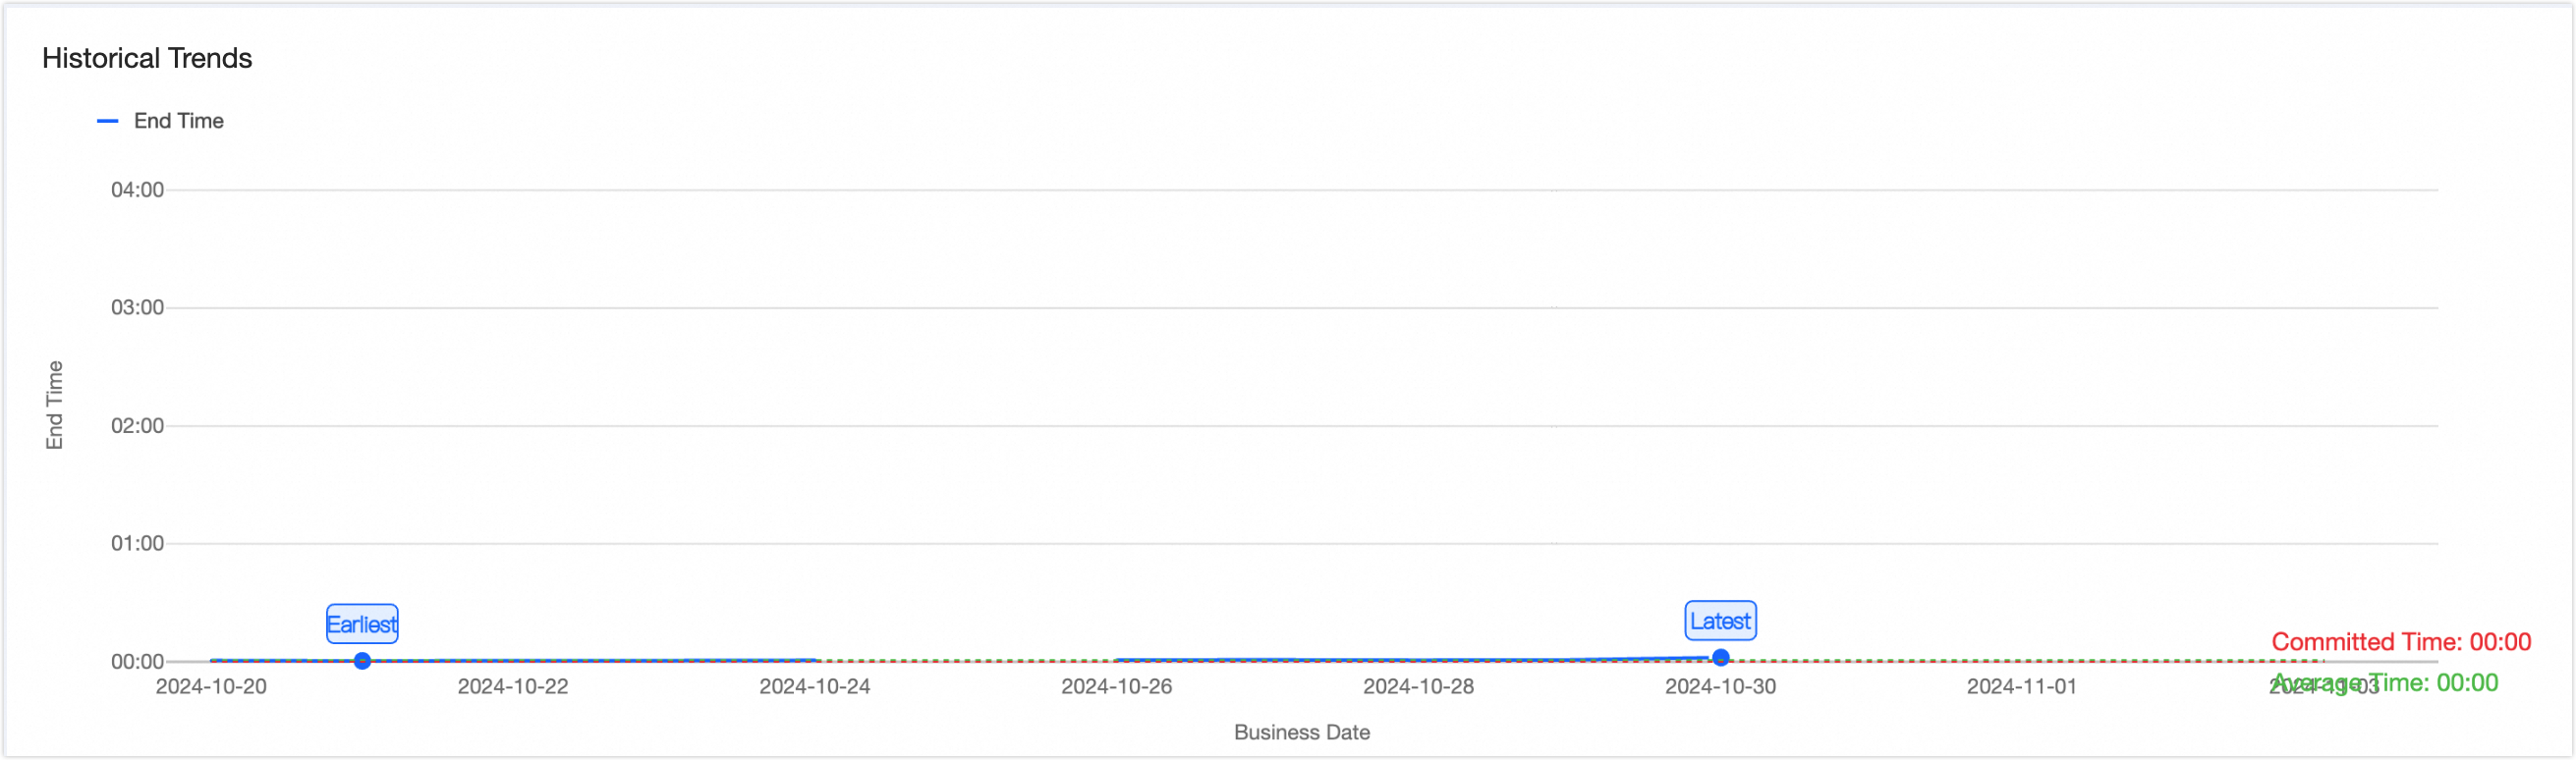
⑤Historical Runtime Trend |
A trend graph of the baseline instance's historical runtime.
Note
|
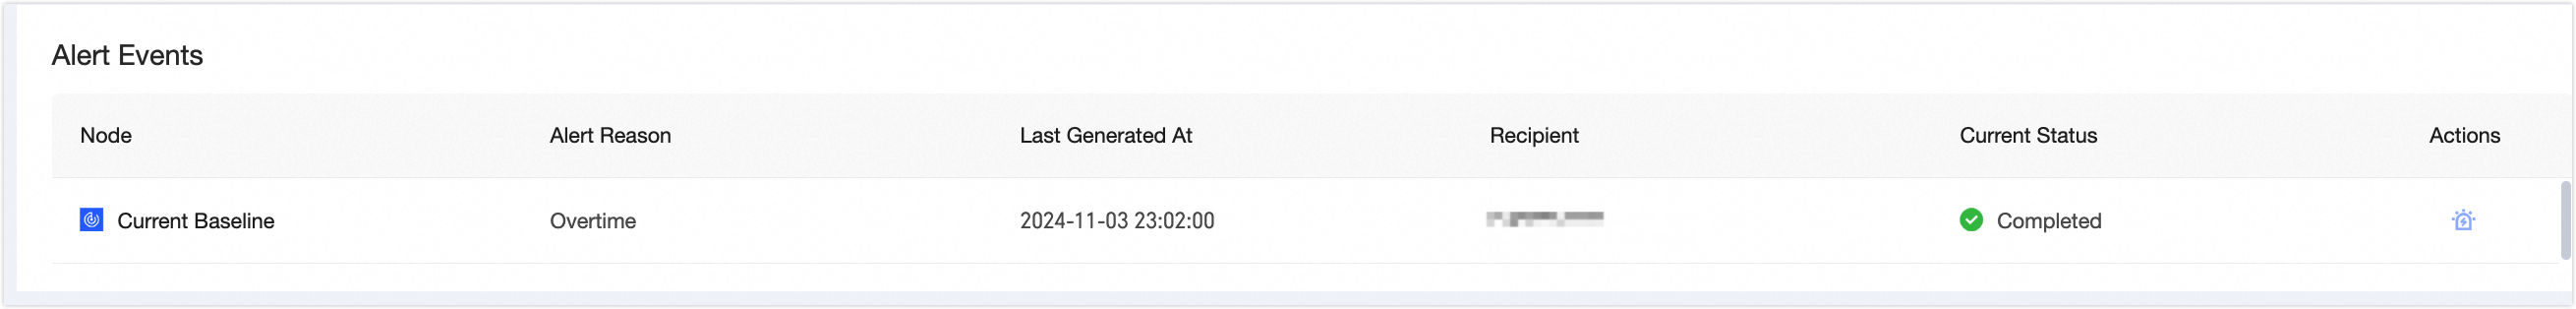
⑥Alert Events |
Records of alert events triggered by the current baseline instance. Includes Alerting Node, Alert Cause, Last Alert Time, Recipient, Current Status, and Operation.
|
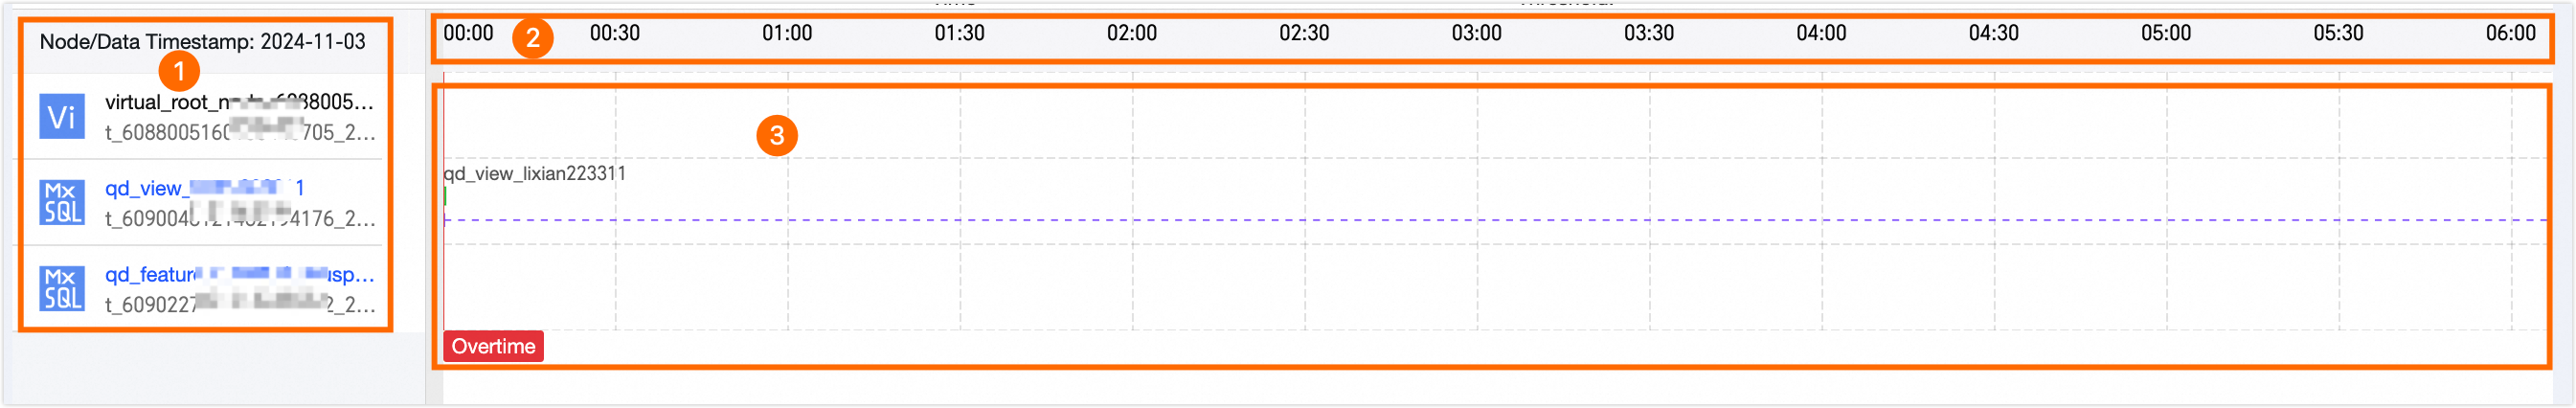
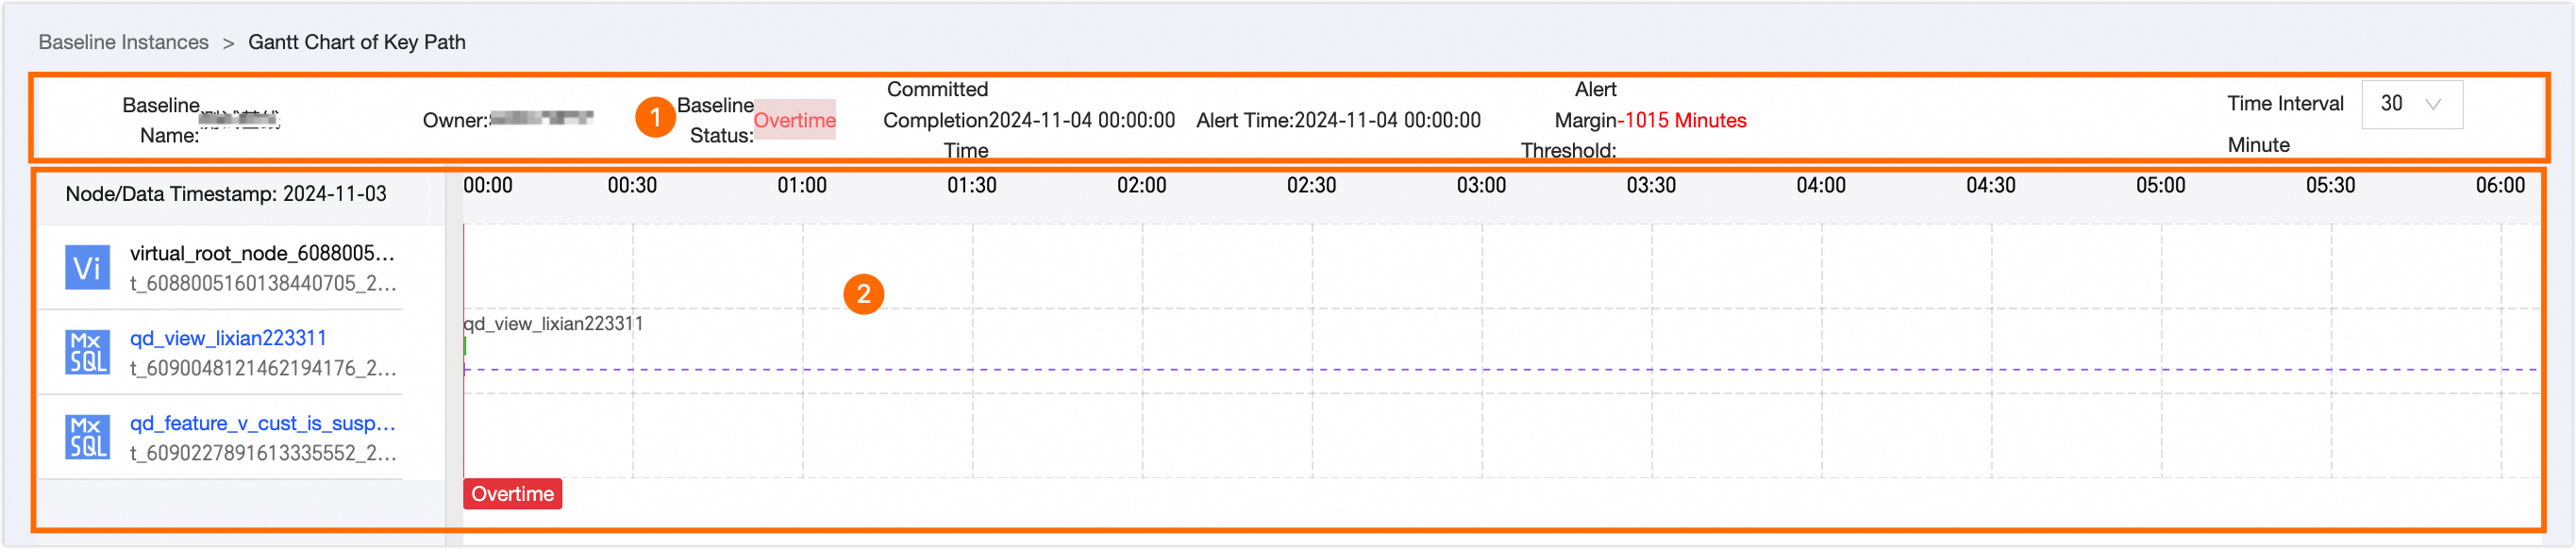
View the critical path Gantt chart
The critical path is the path with the longest duration in a baseline instance. It represents the shortest possible time to complete the baseline instance. The critical path Gantt chart displays the run status of nodes in the baseline instance and their execution time. This chart helps you understand the completion progress of the baseline instance and identify key nodes for effective planning and resource allocation.
Area | Description |
①Basic Information | Basic information for the critical path Gantt chart. Includes Baseline Name, Owner, Baseline Status, Commitment Time, Alert Time, and Margin. You can also adjust the display granularity of the Gantt chart by changing the time interval. You can select 10 minutes or 30 minutes. Note If the runtime is short, select the 10 minute interval for a clearer view of the run status. |
②Critical path Gantt chart | Contains the list of critical path nodes for the current baseline instance, along with the progress time and status information for the instance nodes.
|