After collecting, integrating, and processing your data, you can manage it in the Assets module. This topic explains the global, flow, and structured modes of the asset panorama.
Prerequisites
The asset panorama feature is supported when you use one of the following compute engines: MaxCompute, CDH 5.X, CDH 6.X, FusionInsight 8.X, Cloudera Data Platform 7.x, E-MapReduce 5.x, AsiaInfo DP 5.3, AnalyticDB for PostgreSQL, Transwarp TDH 6.x, or Transwarp TDH 9.3.x.
Asset panorama modes
The asset panorama page displays only the metadata and processed application data in your production environment. It offers the following three modes:
Global mode: Displays business sections with a data storage size greater than 0 in a planetary view. This view shows the total data size of all replicas in production projects, the total number of data tables, the total number of projects, computing consumption, storage, and the number of physical tables.
Flow mode: Visually represents the data processing flow from data import and integration to output.
Structured mode: Illustrates the data structure within a business section by using shapes to represent business entities and lines to represent their relationships.
Global mode
On the Dataphin home page, choose Assets > Asset Panorama from the top navigation bar. The page opens in global mode by default.
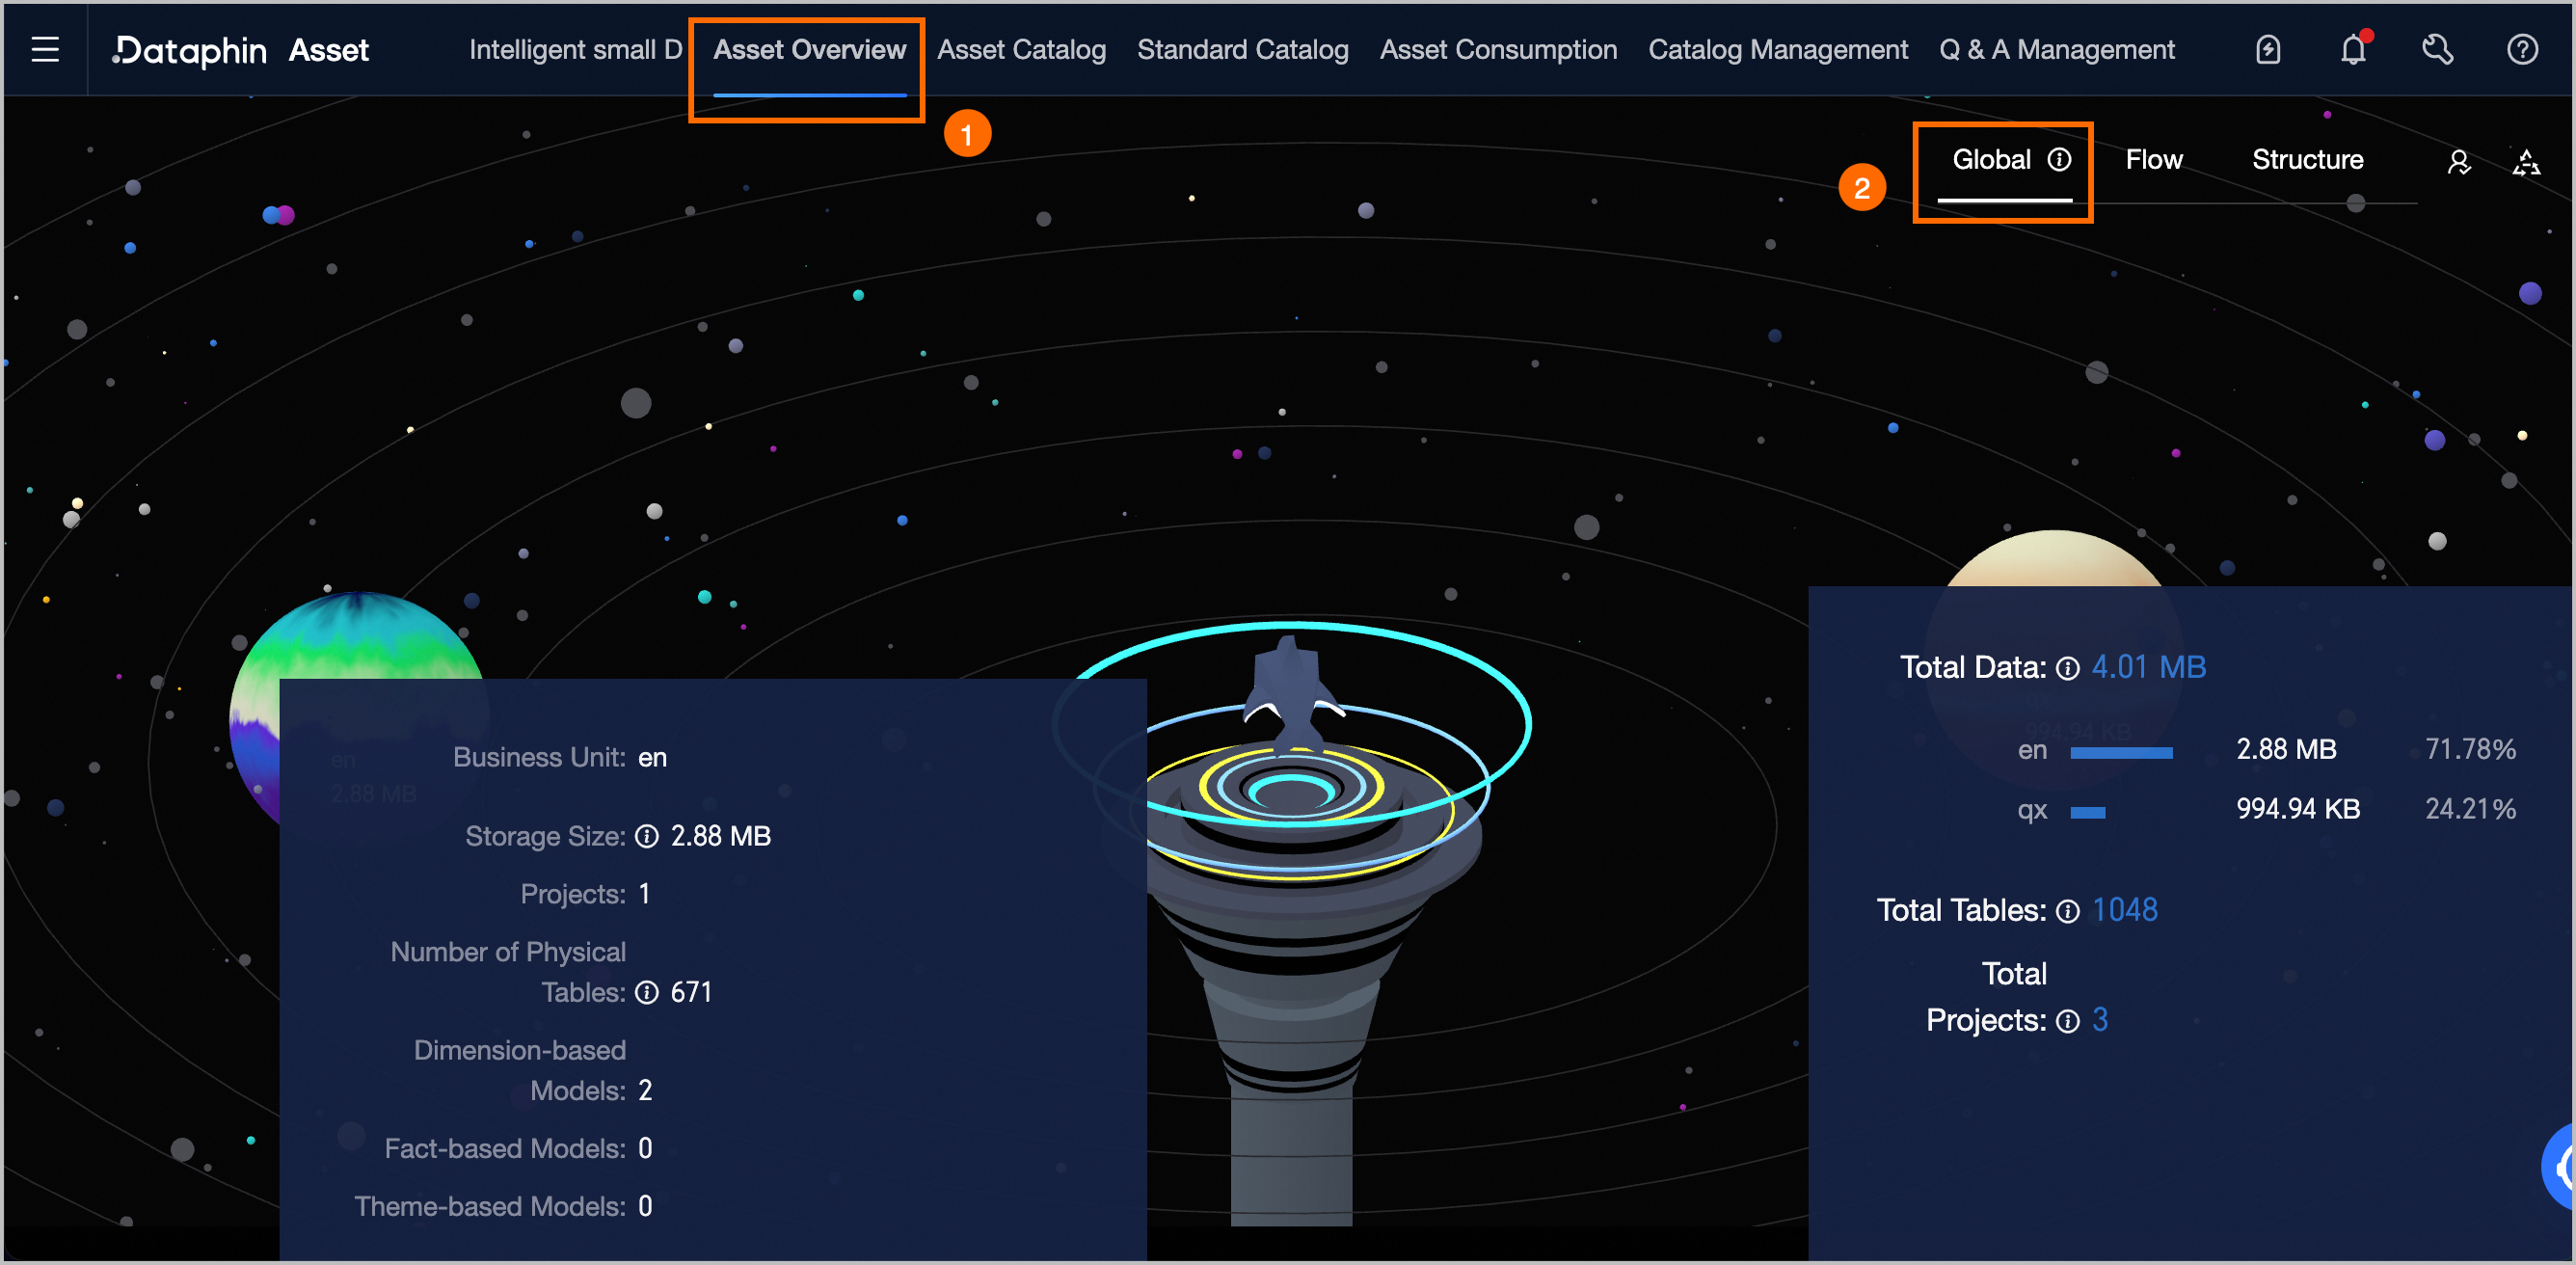
On the Global page, the lower-right corner displays the name and storage of each business section in the production environment, the storage ratio of each replica to the total data size, and the total number of data tables and projects.
Total data size: Distributed data storage may have multiple replicas, depending on the configuration of the compute engine. The displayed storage amount is the total storage of all replicas. Only production projects (including Prod and Basic projects) are counted. This data is updated daily.
Total number of data tables: The total number of physical and logical tables in the production environment. This data is updated in real time.
Total number of projects: The total number of production projects (including Prod and Basic projects). This data is updated in real time.
Hover over a rotating sphere, which represents a business section, to view its computing consumption, storage, and number of physical tables.
Computing consumption: Computing consumption data is available only when the compute engine is MaxCompute. This does not include the computing consumption of Hologres.
Storage: This metric includes only the storage of production projects (including Prod and Basic projects). This data is updated daily.
Physical tables and logical tables (dimension, fact, summary): The total number of physical tables and logical tables of each type in the production environment. The data is updated in near real time.
Flow mode
In the upper-right corner, click Flow to switch to the Flow page.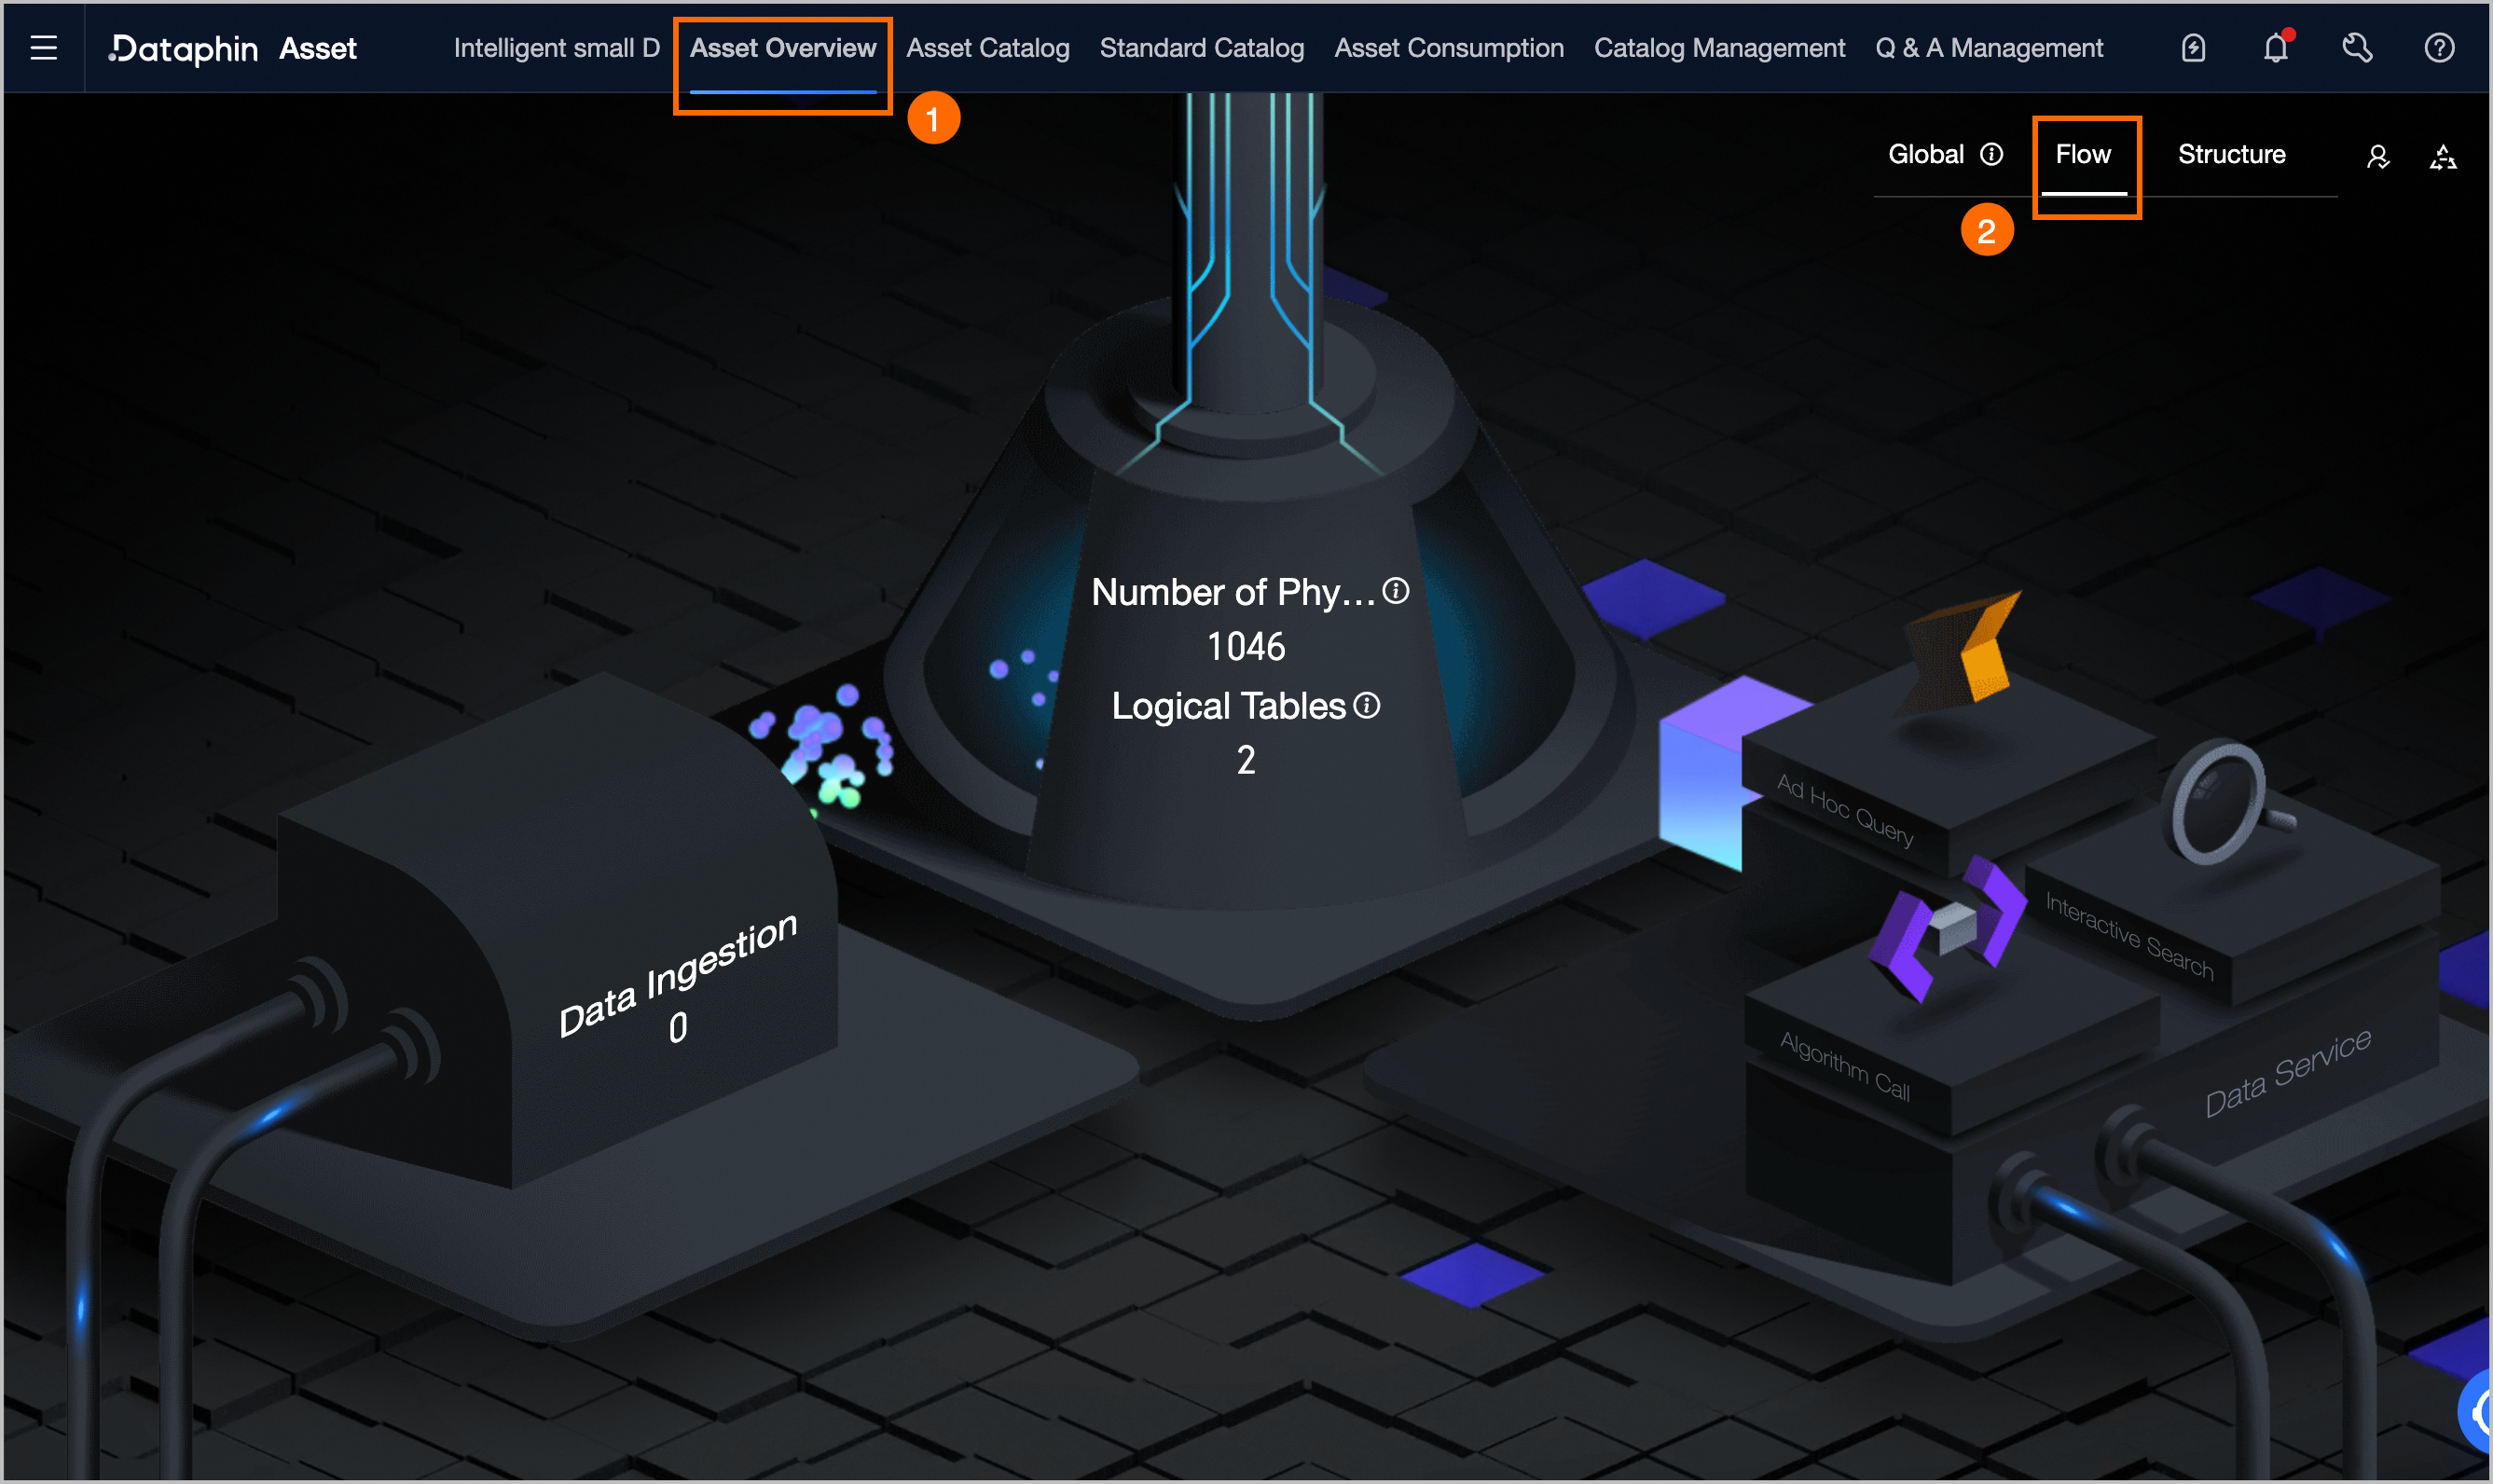
The Flow page shows metrics for data import, the number of physical tables, and the number of logical tables. It also highlights data query and application capabilities available for output data.
Hover over the Data Import area to view the number of data sources, Top 5 data tables by import volume, and Bottom 5 data tables by import volume.
Data sources: The number of data sources that synchronized data to the compute engine on the previous day. The data sources are sorted by the number of successfully synchronized tables. This data is updated daily.
Top 5 data tables by import volume and Bottom 5 data tables by import volume: These statistics are based on instance data from synchronization and integration tasks.
Number of physical tables: The total number of physical tables in the production environment. This data is updated in near real time.
Hover over the Number of logical tables area to view metric counts from the data architecture and data model perspectives.
Data architecture includes the counts of five metric types: business object, business activity, business qualifier, atomic metric, and metric. The metric category includes derived metrics, compound metrics, and custom metrics.
Data model includes the counts of three table types: dimension logical table, fact logical table, and summary logical table. The sum of these three types equals the total number of logical tables in the production environment. This data is updated in near real time.
Structured mode
In the upper-right corner, click Structure to switch to the Structure page.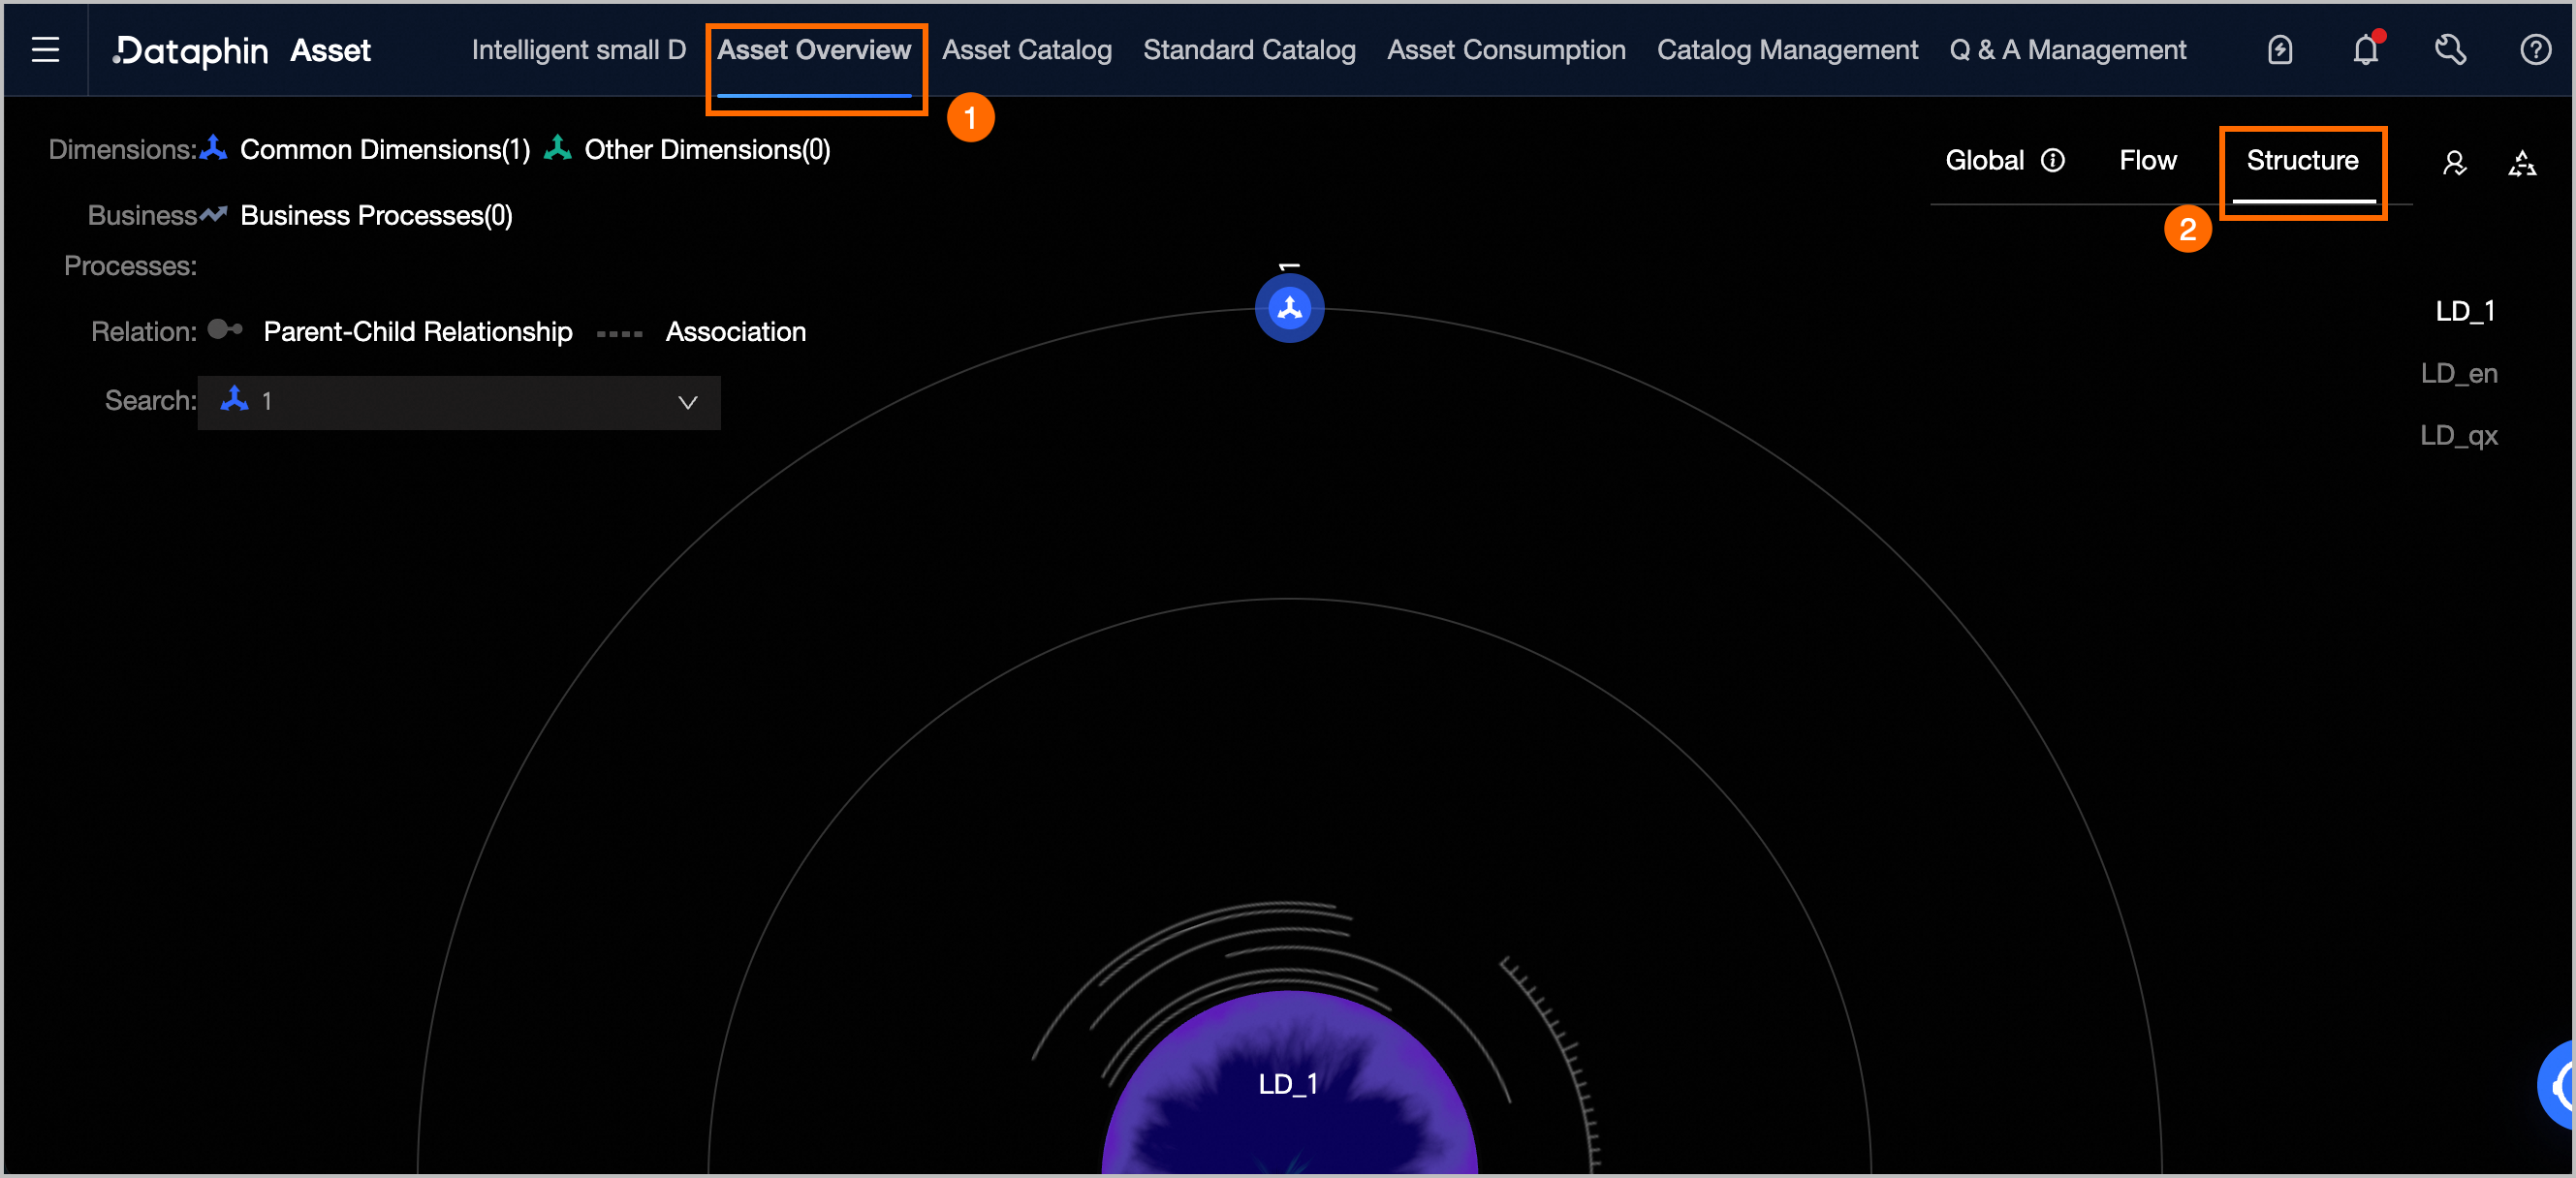
On the right side of the Structure page, click a business section to display its business objects, business processes, and their relationships.
Business object: A business object is a subject or entity involved in a business activity. It is typically a persistent entity that does not disappear when an event occurs.
Business process: A business process is an indivisible event within a business activity.
Relationship refers to the association between dimensions:
Dimensions with a parent-child relationship are connected by the
 icon.
icon.Dimensions with an associative relationship are connected by the
 icon.
icon.
In the central visualization view on the Structure page, view relationships as follows:
Click a business object to highlight its associated entities and business processes.
Click a business process to highlight its associated dimensions.
In the Search bar, enter the name of a business object or business activity to perform a search. Alternatively, click the
 icon next to the Search bar, and then select a business object or business activity from the drop-down list to view its associated objects.
 icon next to the Search bar, and then select a business object or business activity from the drop-down list to view its associated objects.