The quality dashboard shows the number of tables validated by quality rules, tables with abnormal results, and trends in rule applications and violations, helping you quickly identify and resolve quality issues.
Permissions
-
Super administrators, quality administrators, or users with a custom global role that has the Quality Rule - Manage permission can view global quality monitoring data.
-
Other members can only view the quality monitoring data for the production projects they have joined.
NoteFor projects in Dev-Prod mode, members can view the quality monitoring data of the production project, regardless of which project they are a member of (development, production, or both).
Introduction to the quality dashboard
-
Navigate to the Dataphin home page, select Administration > Data Quality from the top menu bar.
-
In the navigation pane on the left, choose Overview > Quality Dashboard to access the Quality Dashboard page.
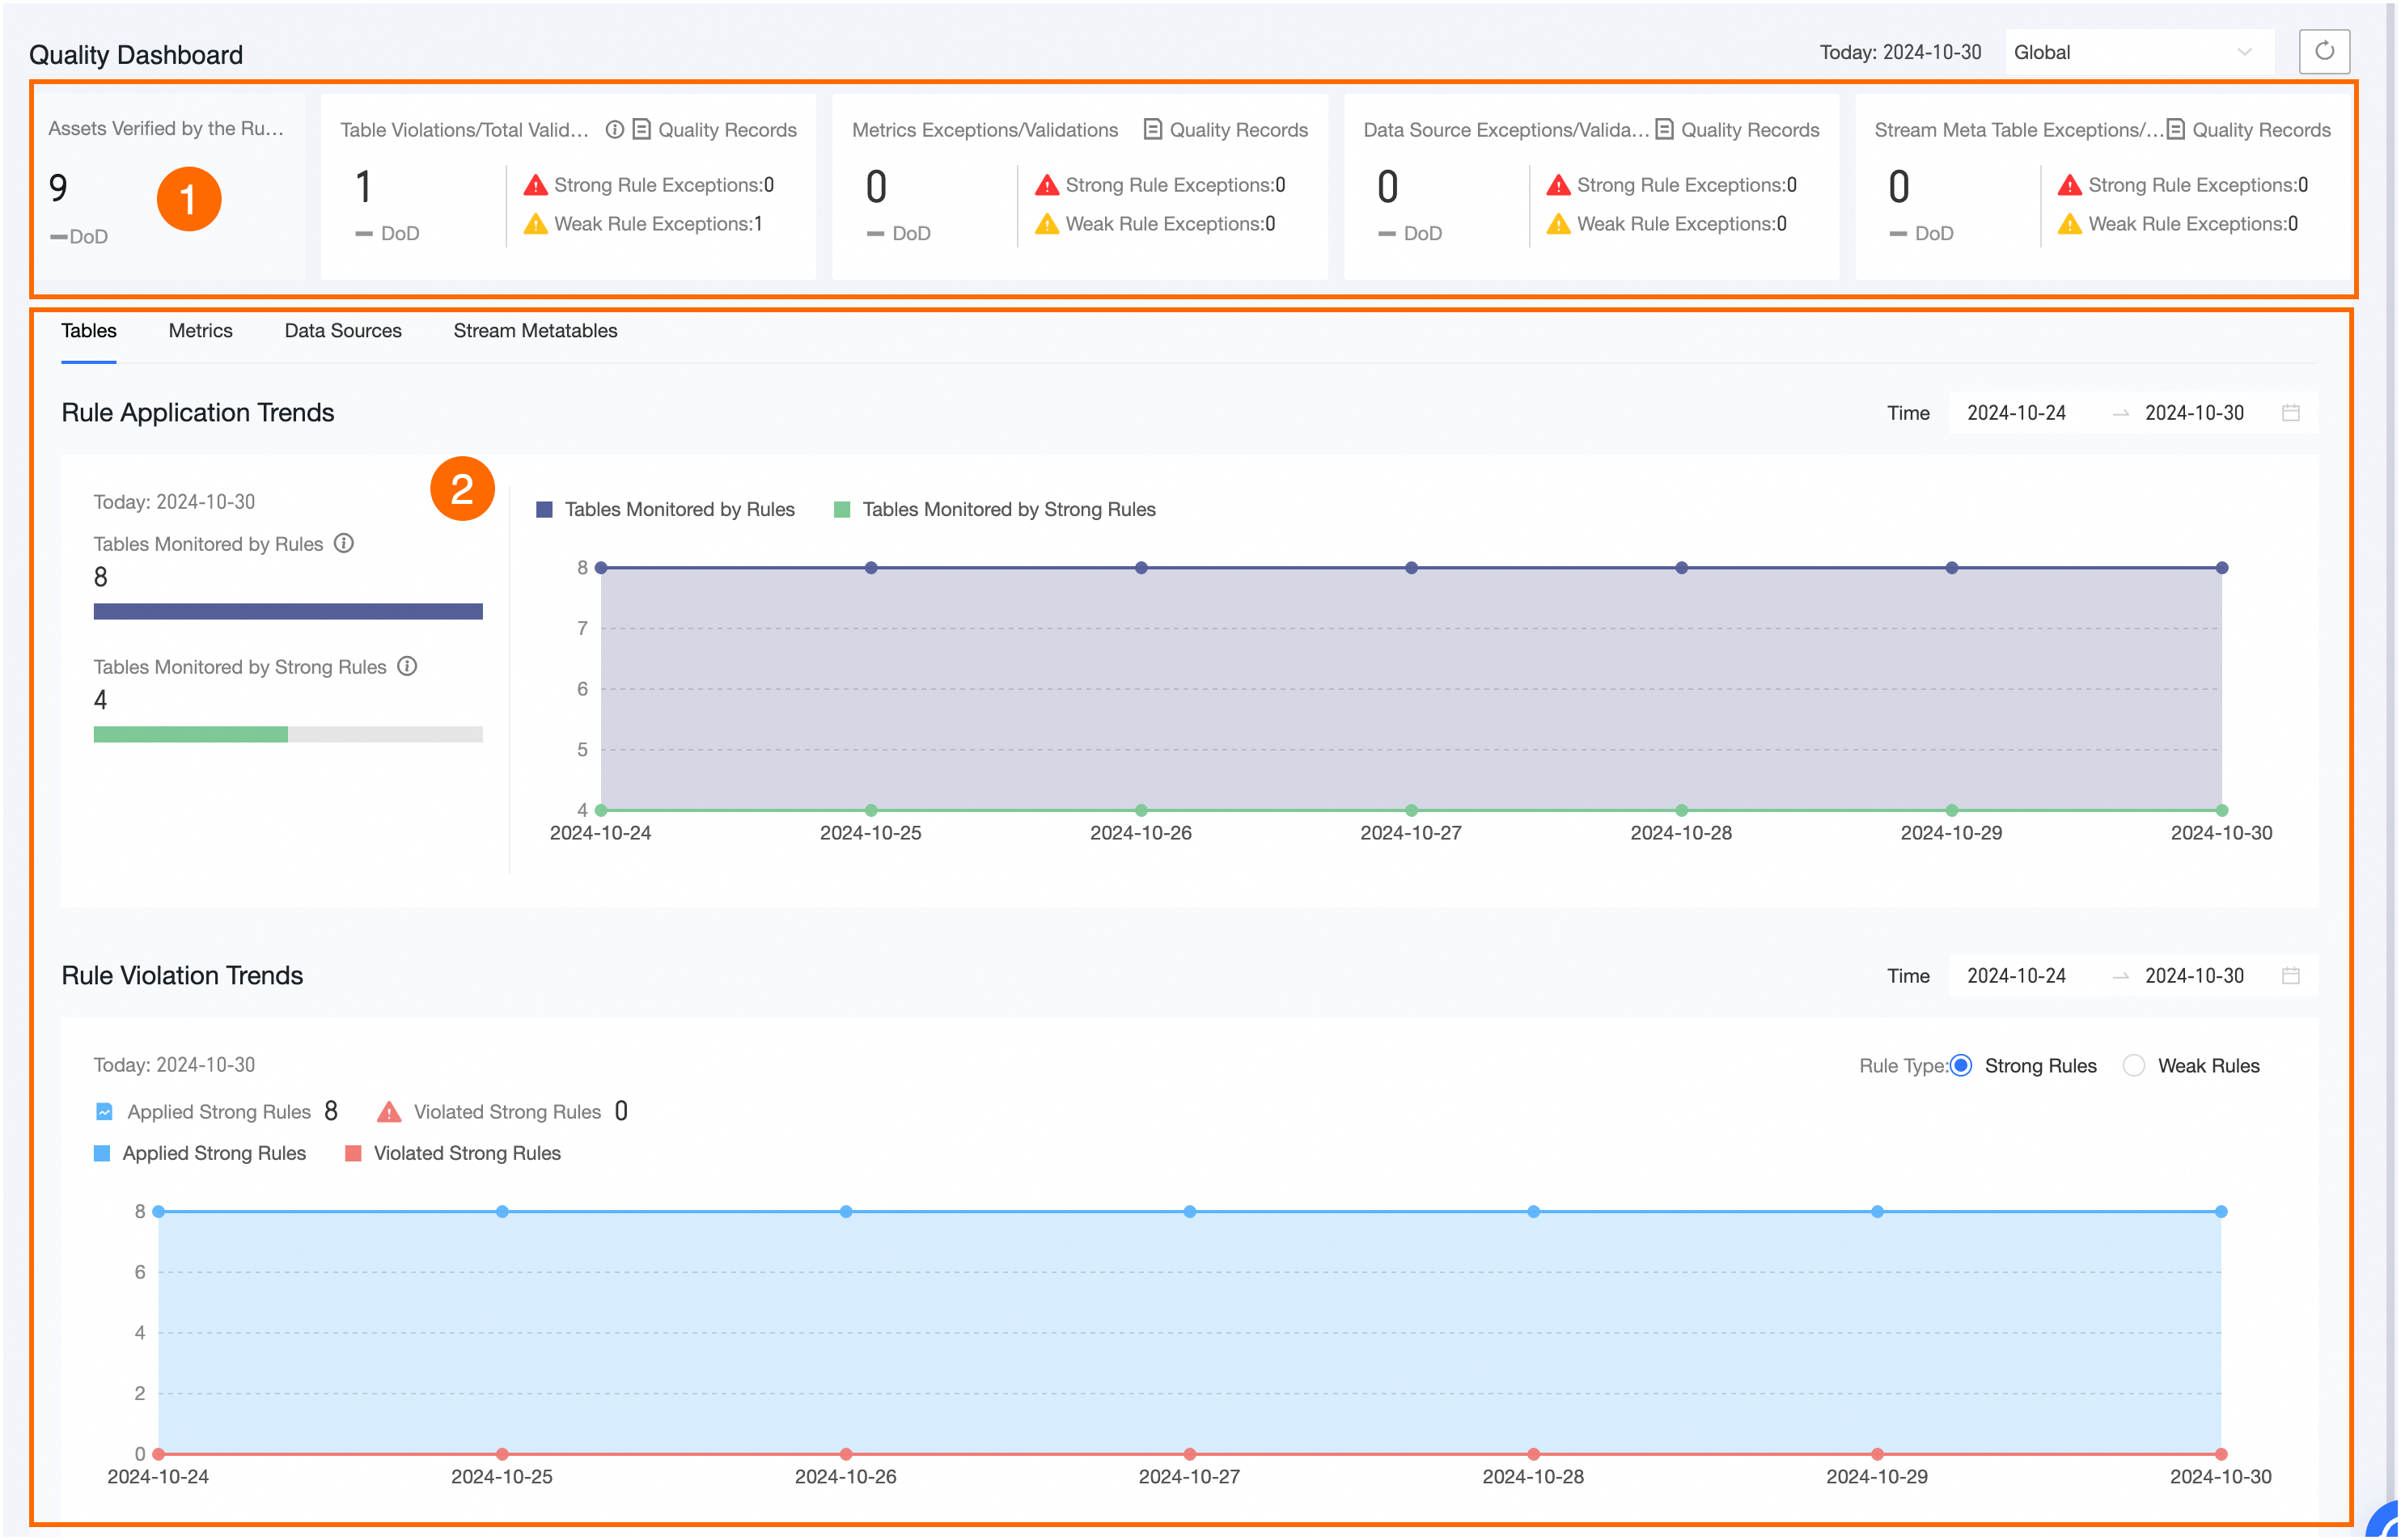
Number
Description
①
-
Shows the total Number Of Assets Validated By Rules.
-
Shows the Number Of Abnormal Data Tables, Number Of Abnormal Rules For Metrics, Number Of Abnormal Data Sources, and Number Of Abnormal Real-time Meta Tables, with day-over-day comparisons.
Click the
 icon above the display area to view detailed rule validation information.
②
Displays the Data Tables, Metrics, Data Sources, and Real-time Meta Tables with their respective Rule Application Trends and Rule Violation Trends. The content varies by page.
NoteData tables include only physical tables, logical tables, and global data tables. Data sources are limited to offline physical data sources.
-