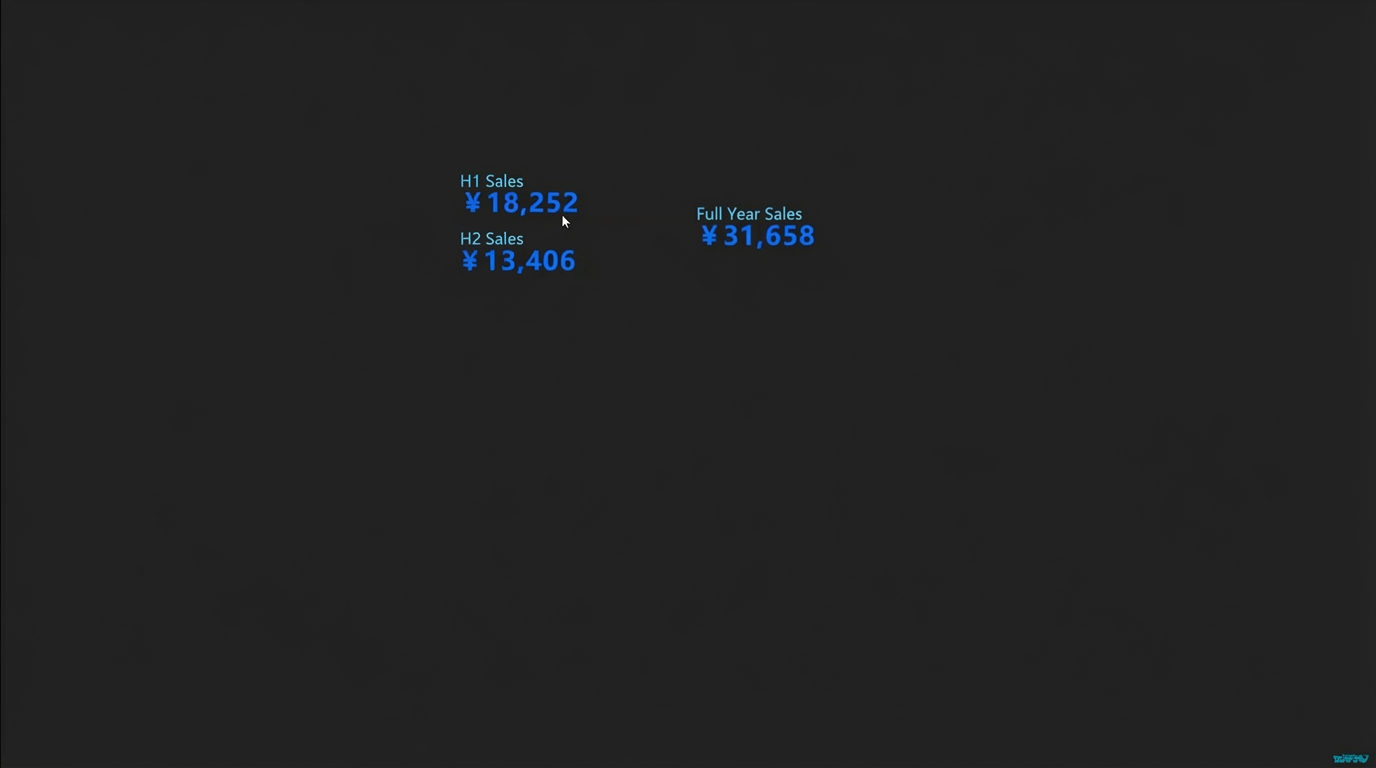
Sum dynamic data
Use the Blueprint Editor to sum real-time data from multiple ticker board widgets and display the result in a separate ticker board.
Demonstration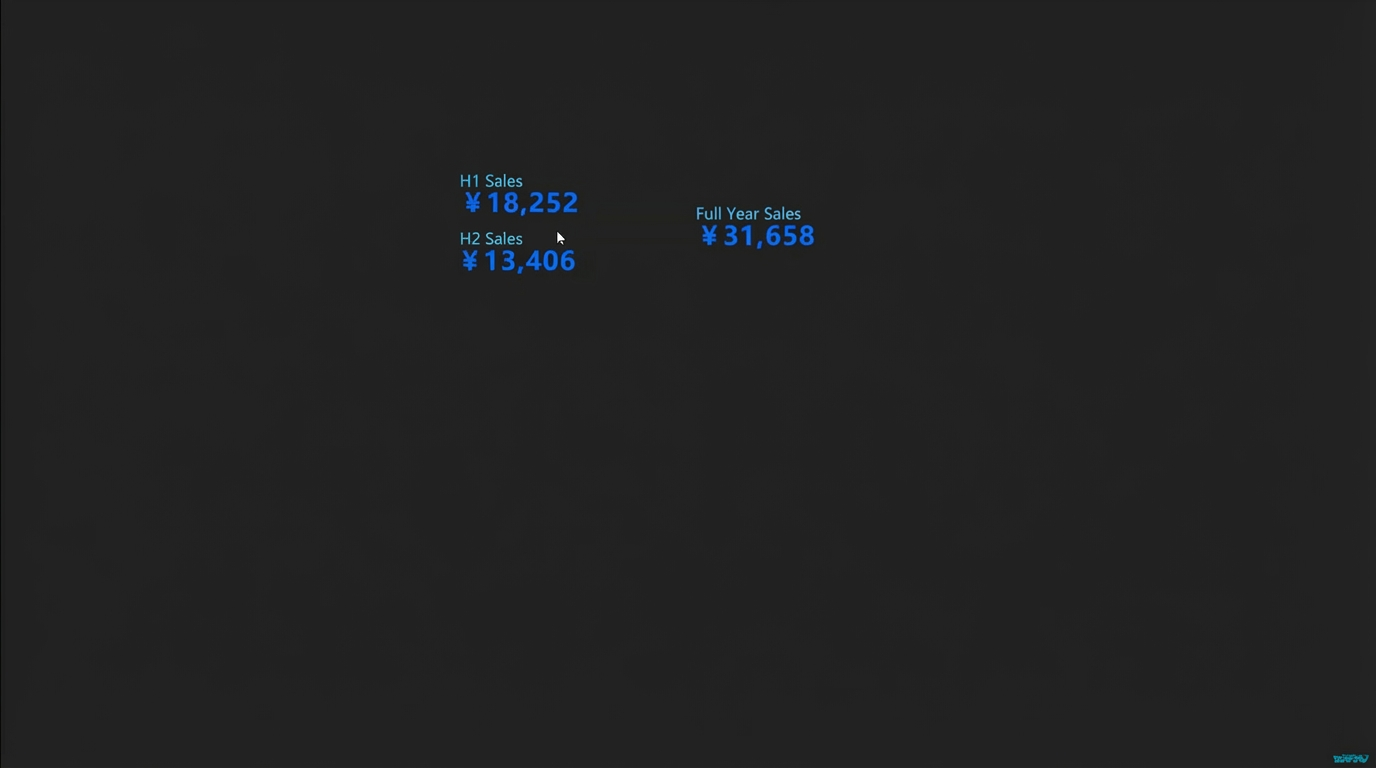
Procedure
Log on to the DataV console.
-
Select a visualization application and click Edit to open the canvas editor.
-
Add three ticker board widgets to the canvas.
-
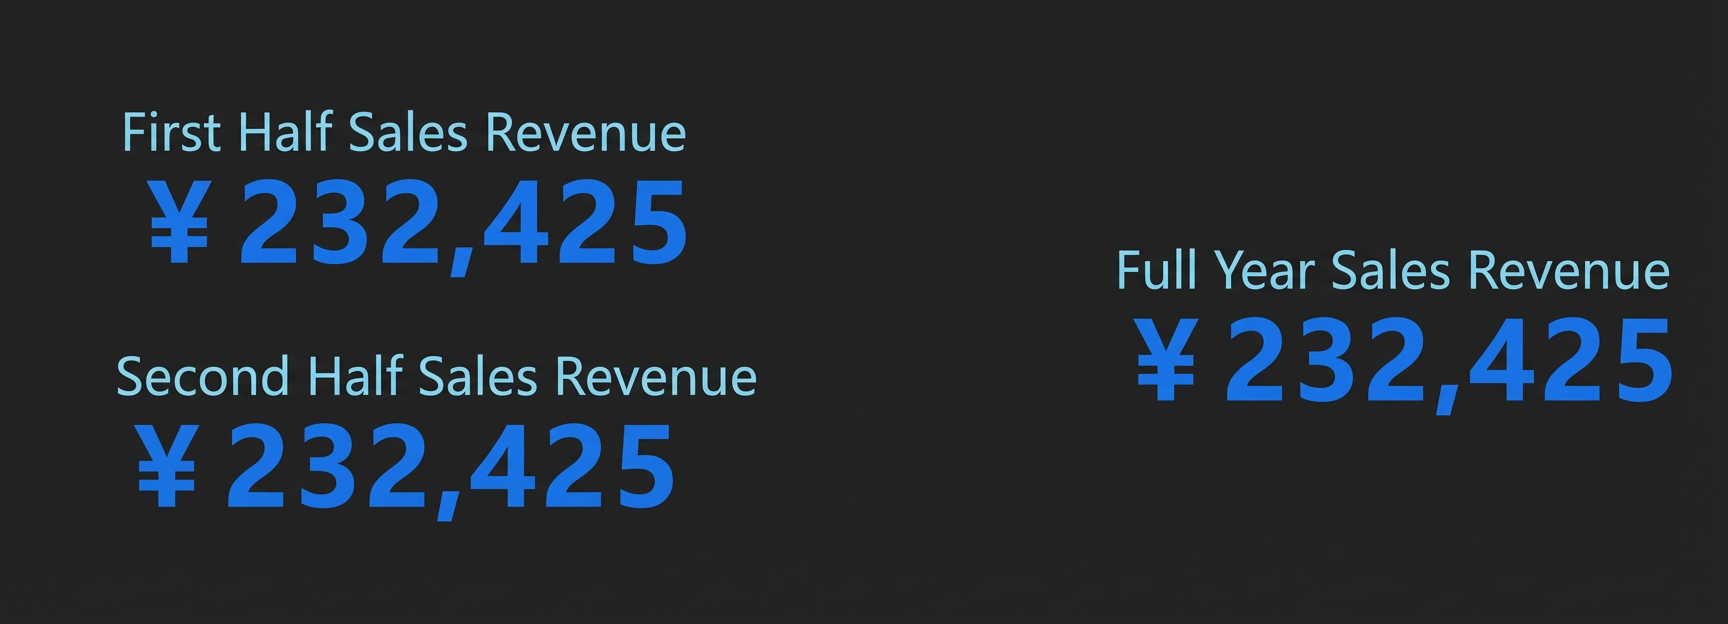
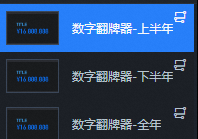
Click a ticker board widget. On the configuration panel, set Title > Title to Sales in H1. In the layer panel, double-click the widget and change its name to Ticker Board-H1. Repeat this step to configure the other two ticker board widgets.
-
Select all widgets, right-click, and select Export to Blueprint Editor.
-
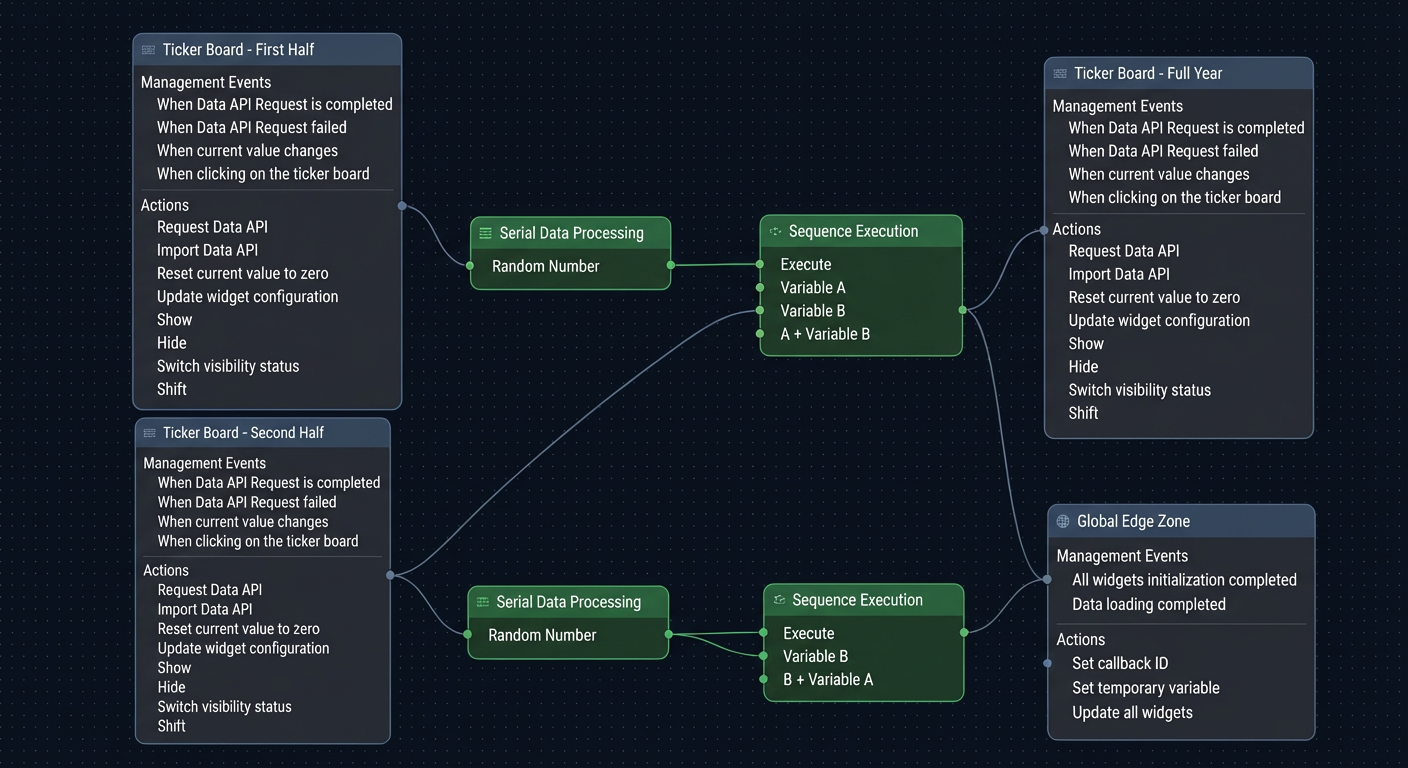
Add a serial processing node and a sequence execution node, and then connect the widgets.
-
Serial processing node: Generates random data when you click a ticker board. Both nodes use the same processing method. The H2 data is produced by adding a random number to the H1 data.
var value = Math.random() * 10000 return [ { "name": "", "value": 12345 + value } ] -
Sequence execution node: Saves data as a temporary variable, adds the values from the two ticker boards, and feeds the sum into the display widget.
// Variable A
return {
 data: [
 {
 name: "up",
 value: data[0].value || 0
 }
 ]
};
// Variable B return { data: [ { name: "down", value: data[0].value || 0 } ] };// A + Variable B let dowm = getLocalValue('dowm') || 0; let res = data && data.length !== 0 ? data[0].value + dowm : down return [{ value: res }];// B + Variable A let up = getLocalValue('up') || 0; let res = data && data.length !== 0 ? data[0].value + up : up return [{ value: res }];
-
-
In the upper-right corner of the page, click the
 icon to preview the results.