Dynamically show and hide widgets
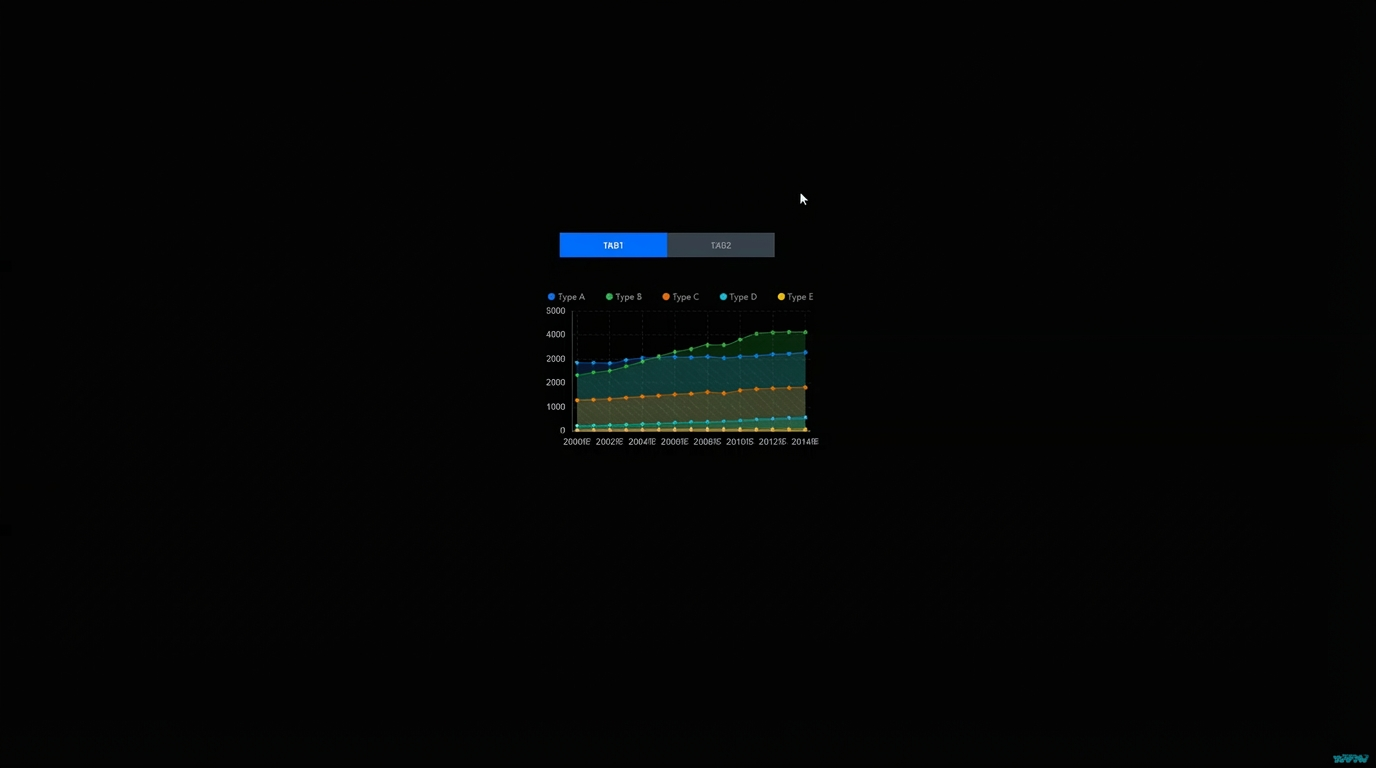
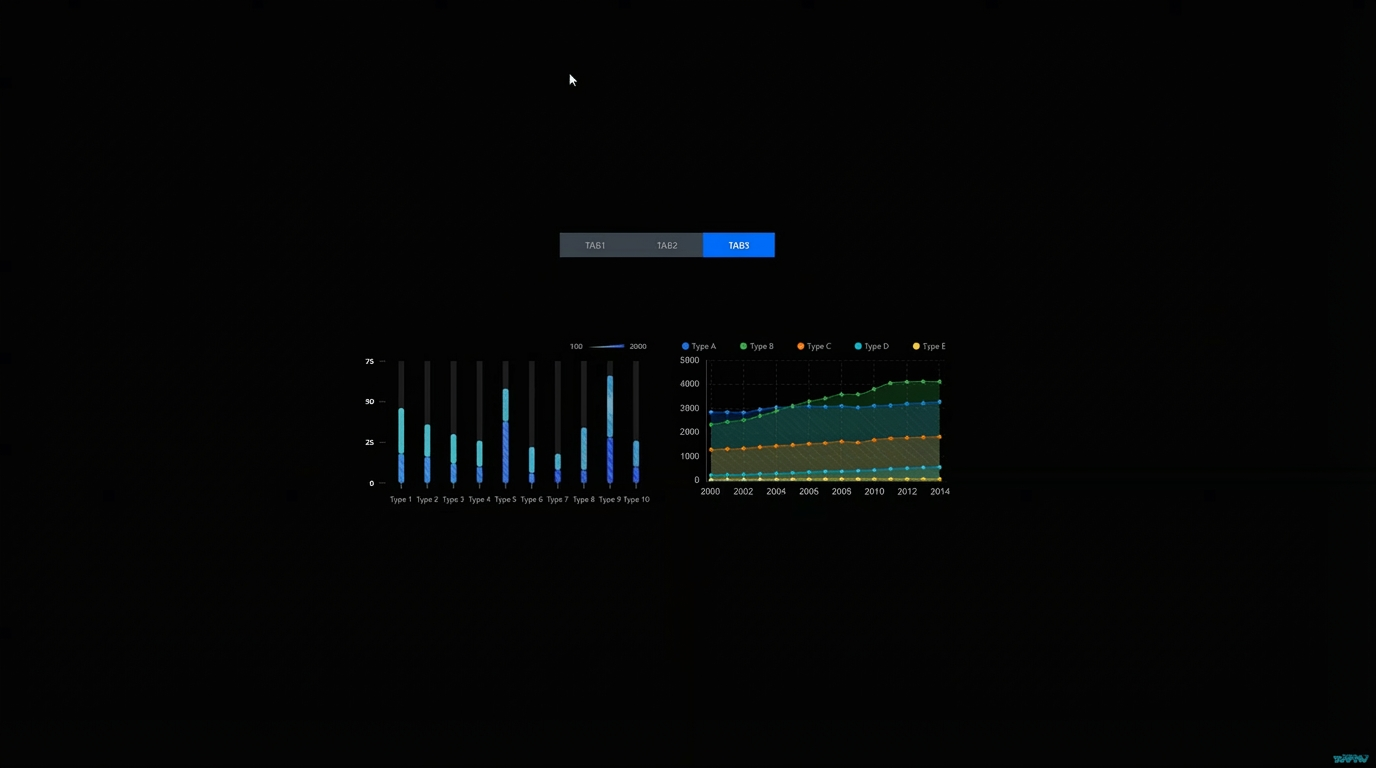
This document describes how to dynamically show and hide widgets. The example uses a Tab List widget to control the visibility of an Area Chart widget and a Basic Column Chart widget.
Demonstration
Implementation of tab list IDs
Using a carousel in a group
Procedure
Log on to the DataV console.
Select a visualization application and click Edit to open the canvas editor.
Add a Tab List widget, an Area Chart widget, and a Column Chart widget to the canvas.
In the Layers panel, select all widgets, right-click, and select Export to Blueprint Editor.
Connect the widgets.
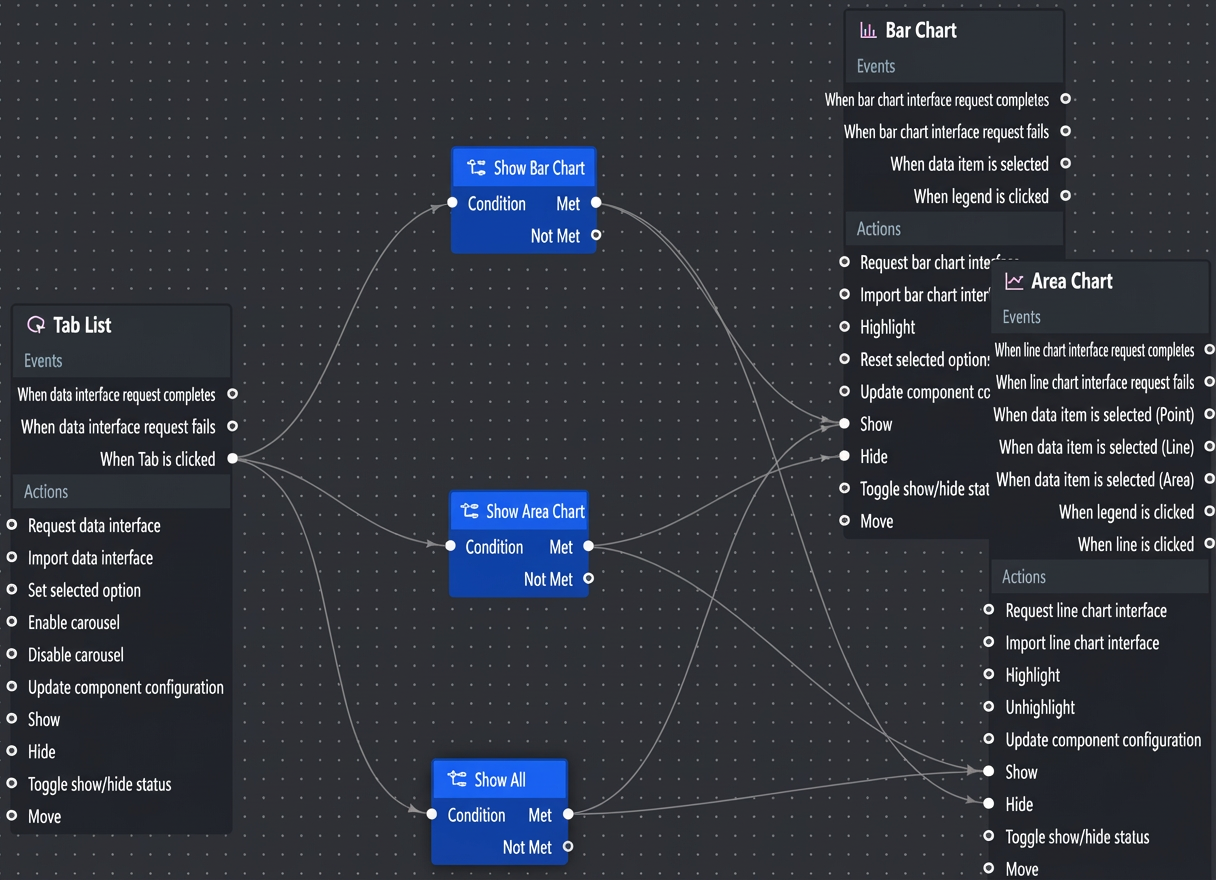
Configure the processing method for the branch judgment node.
return data.id == 1; // Show the column chart
return data.id == 2; // Show the area chart
return data.id == 3; // Show all
Click the
 icon in the upper-right corner of the page to preview the results.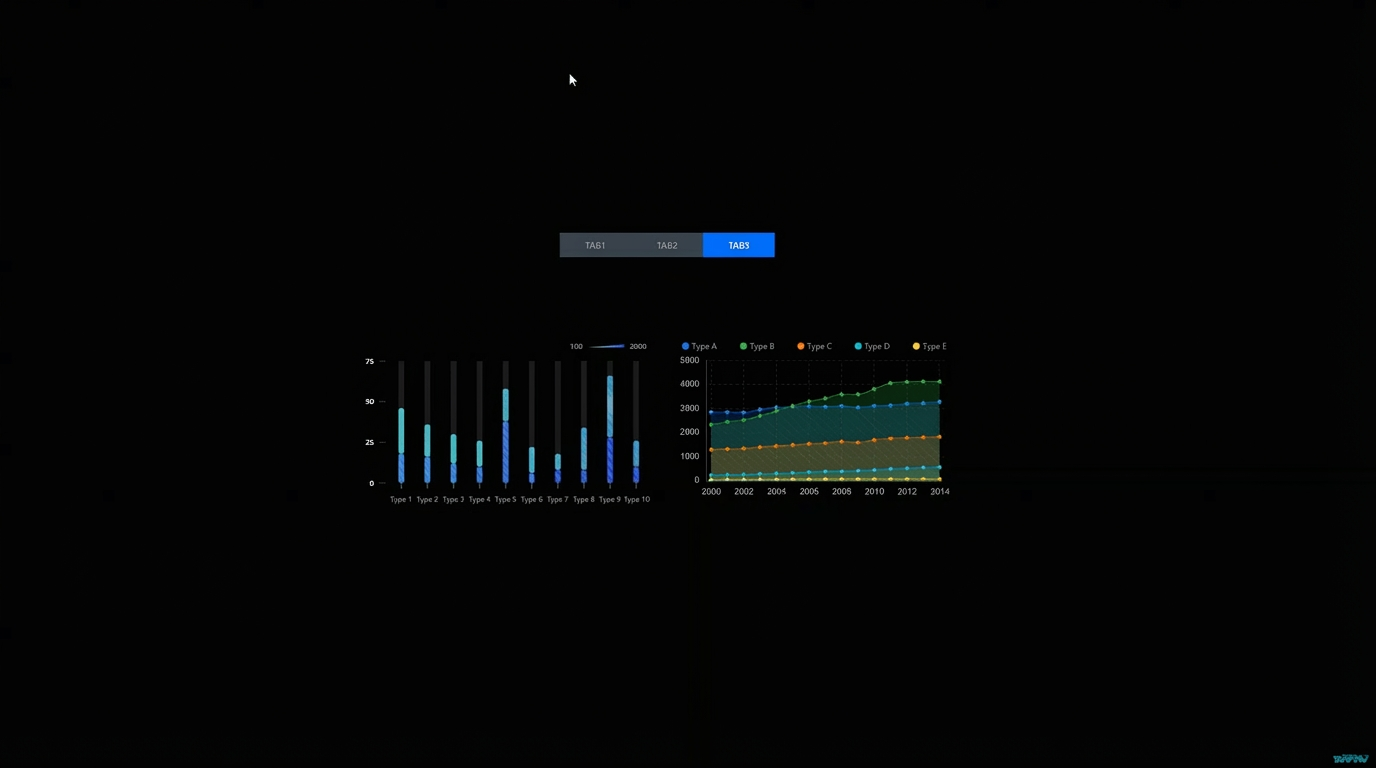
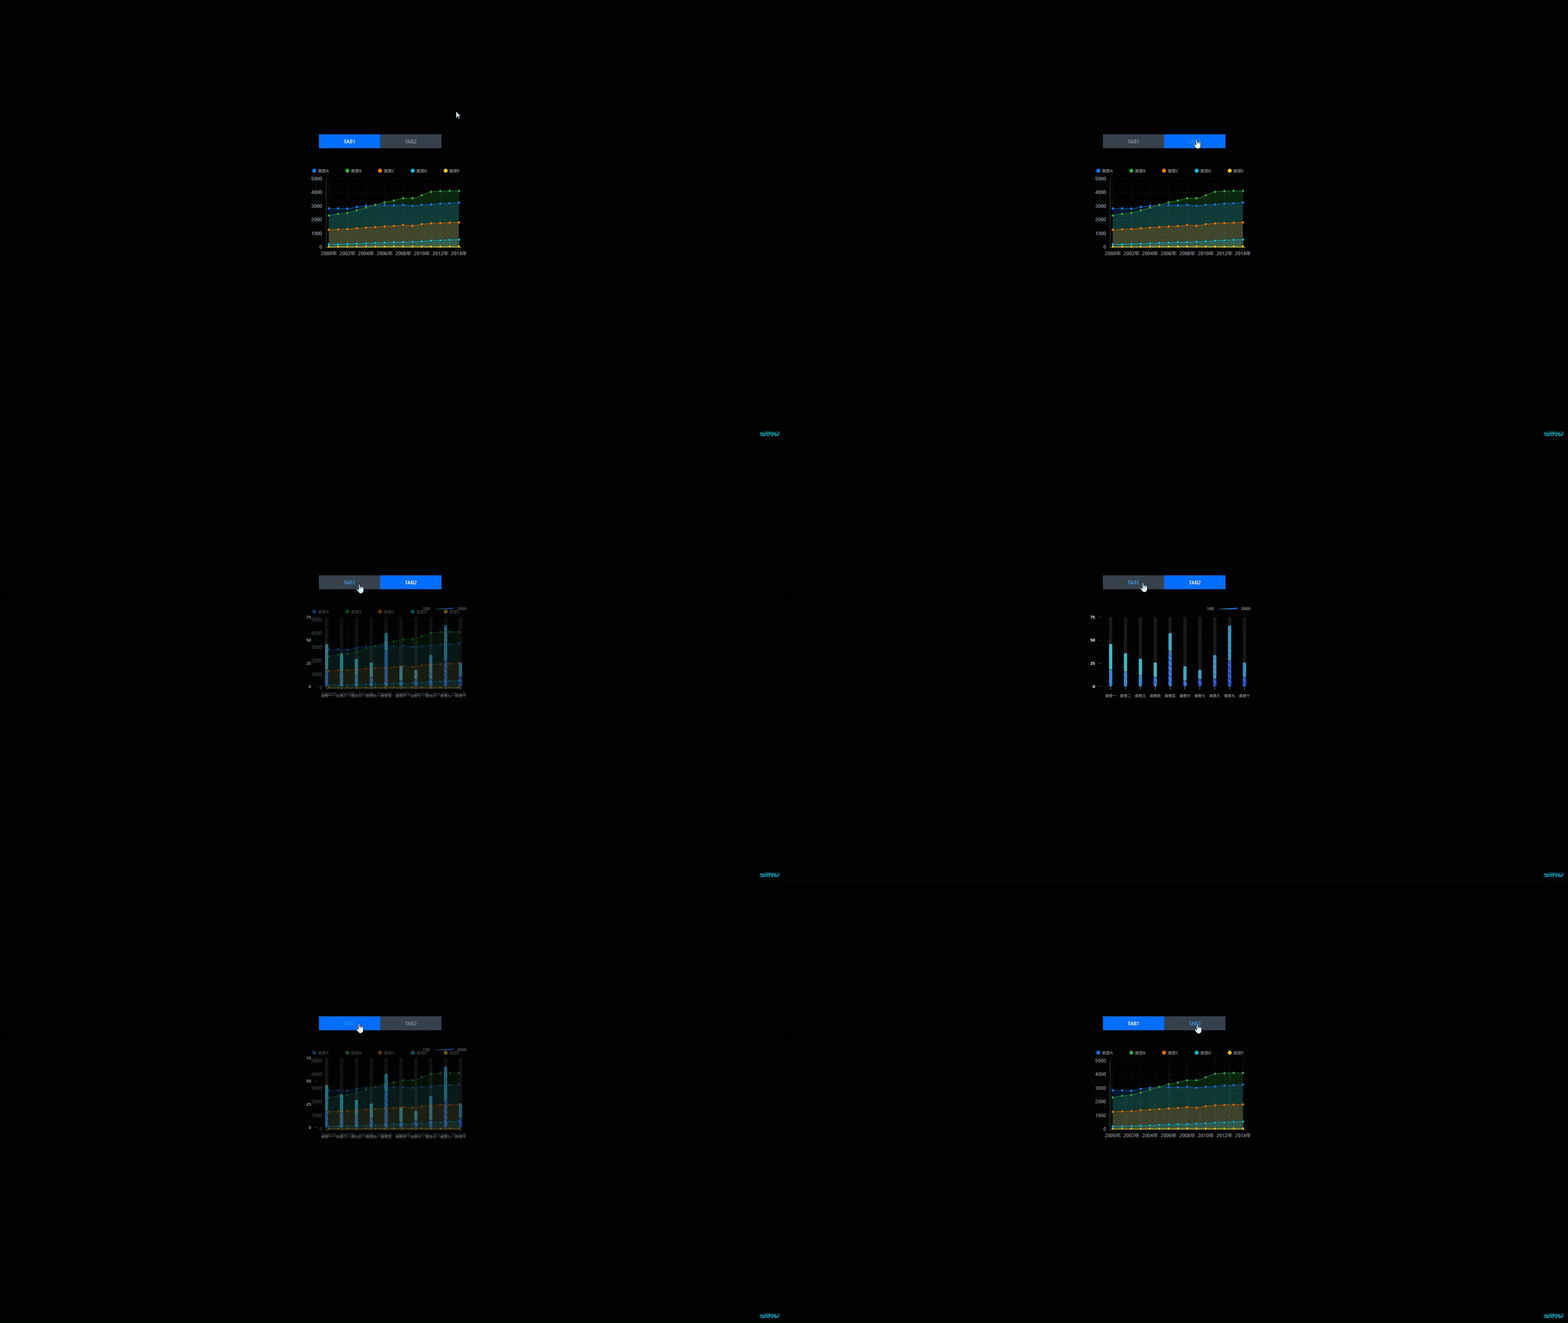
(Optional) Change the tab list data to have two values. Group the area chart and the column chart. In the Basic Settings of Carousel for Grouped Objects, set Trigger Method to Event Trigger.
(Optional) Export the group to the blueprint editor and connect the nodes.
(Optional) Configure the processing method for the serial data processing node.
return { index: data.id - 1 };(Optional) Click the
 icon in the upper-right corner of the page to preview the results.
 icon in the upper-right corner of the page to preview the results.