Implement dynamic highlighting
Updated at:
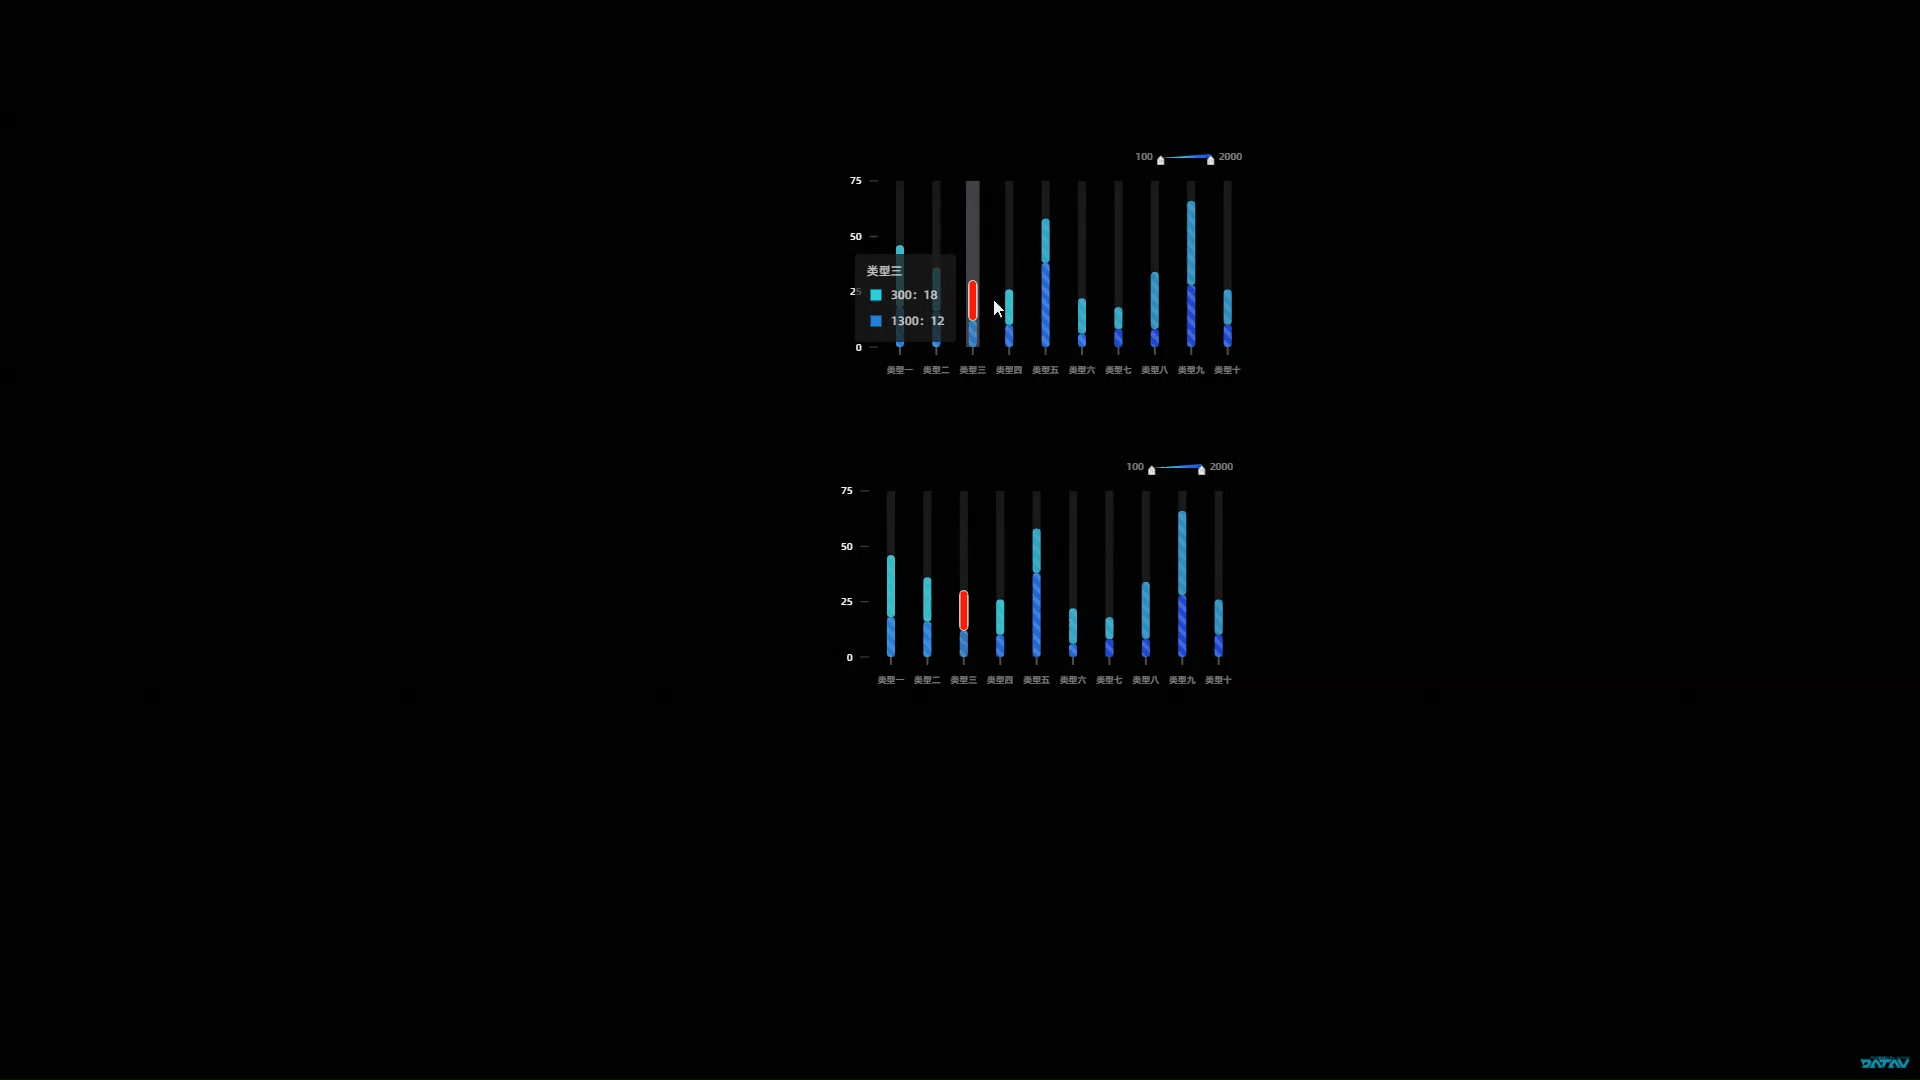
Configure interactive highlighting between Column Chart widgets so that interacting with one chart dynamically highlights data in the other.
Demonstration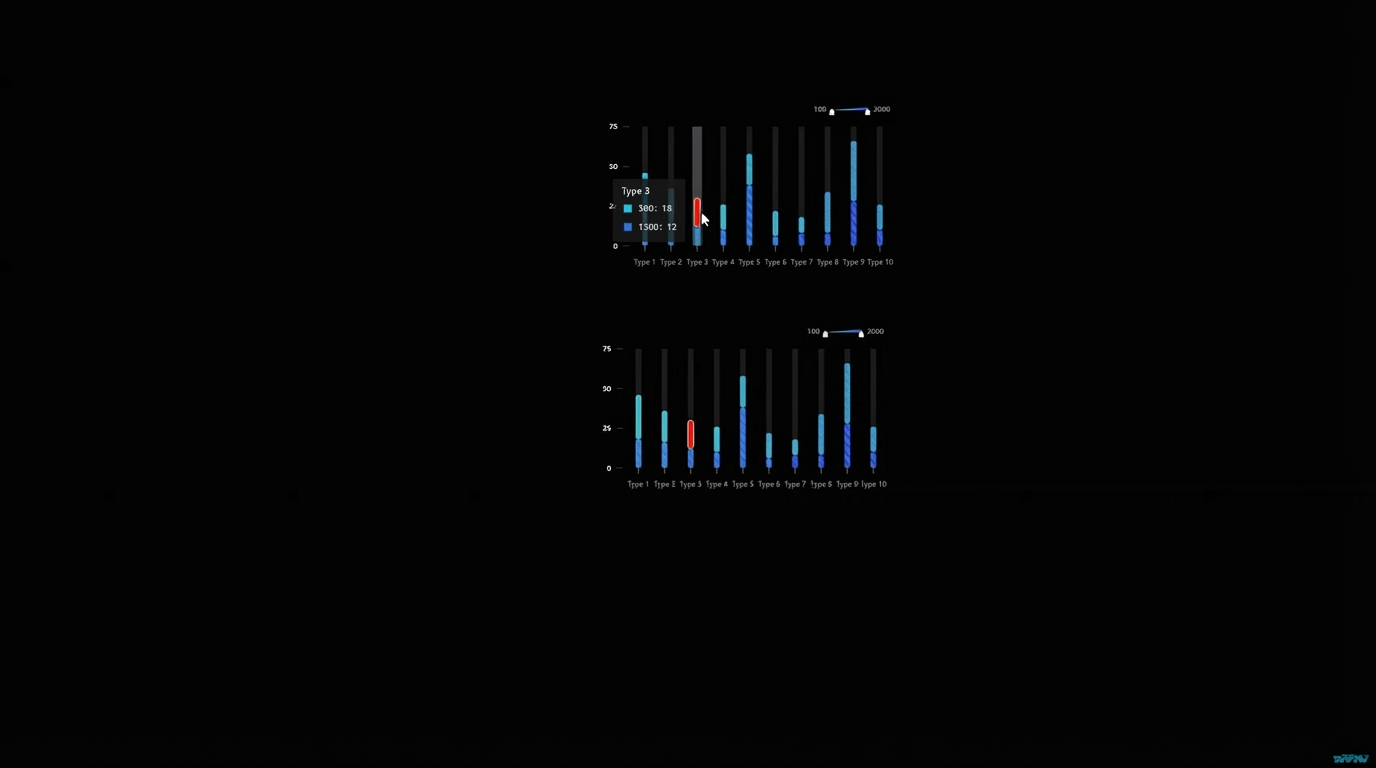
Procedure
Log on to the DataV console.
-
Select a visualization application and click Edit to open the canvas editor.
-
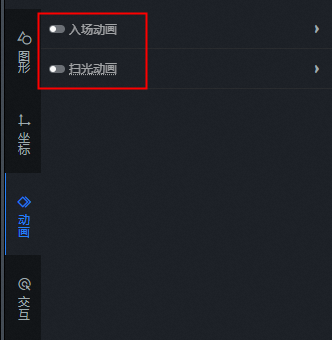
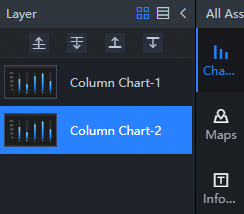
Add two Column Chart widgets to the canvas. Turn off all animation effects and rename the widgets to Column Chart-1 and Column Chart-2.
-
In the Layers panel, select all widgets, right-click, and select Export to Blueprint Editor.
-
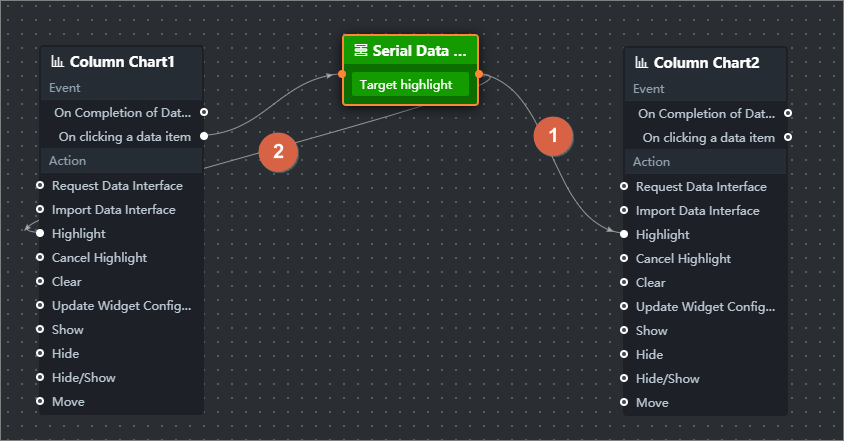
Connect the widgets.
-
Configure the processing method for the two serial data processing nodes.
return { "data": { "x": data.x, "y": data.y, "colorField": data.colorField }, "style": { "fillStyle": "#f00"// Highlight color } } -
Click the
 icon in the upper-right corner of the page to preview the result.
Is this page helpful?