Blueprint debugging guide
Background information
The blueprint debugging feature lets you debug the interaction logic between widgets and variables directly in the editor. This feature reduces the need to switch between editing pages and makes the building and debugging process smoother.
Prerequisites
You have purchased a product edition such as Enterprise Edition, Professional Edition, or Premium Edition.
A data dashboard has been created. You can create one from a template, create one from a blank canvas, or generate one with AI.
You have added a widget and configured its Blueprint interaction occurrences or actions.
Open the blueprint debugging page
Access the DataV console.
On the All Applications page, hover over the target data dashboard and click Edit to open the canvas editor.
On the dashboard editor page, you can open the blueprint debugging window in four ways.
Method 1: After you enable interaction mode, click the Blueprint Debug
 icon to open the blueprint debugging window.
Method 2: In the Layer or Variable pane, click the Blueprint Debug
 icon to open the blueprint debugging window.Note
The Blueprint Debug icon appears after you configure interactions for the widget or variable.
Method 3: In the widget interaction pane, click the Blueprint Debug
icon to open the blueprint debugging window.NoteThe Blueprint Debug icon appears after you configure interactions for the widget.
Method 4: In the blueprint editor, hover over a widget or variable node. Click the Blueprint Debug
icon to open the blueprint debugging window.
When you open the blueprint debugging window, the editor automatically initializes the blueprint interactions. This process triggers related events, such as global node events and data requests for widgets or variables.
When you enter blueprint debugging mode, the following editing operations are restricted.
The widget outline tree is not editable.
The widget styles are not editable. Click Exit Blueprint Debugging to edit them.
The data source is not editable. Click Exit Blueprint Debugging to edit it.
In the Component Advanced Panel, you cannot associate global variables or add or change interaction actions. You can only change the filters, action configurations, and condition configurations of interaction occurrences. To make other changes, click Exit Blueprint Debugging.
Interface overview
After you open the blueprint debugging page, you can debug blueprint events. The following table describes the features available on this page.
Number |
Description |
1 |
The debug object selection toolbar. Use it to select a debug object and filter upstream and downstream interaction paths. |
2 |
The interaction debug path canvas. It displays the interaction debug path and lets you start debugging. |
3 |
The debug results window. It displays debug information, such as action or event parameter information and parameter source tracing. |
Blueprint debugging process
Select a debug object
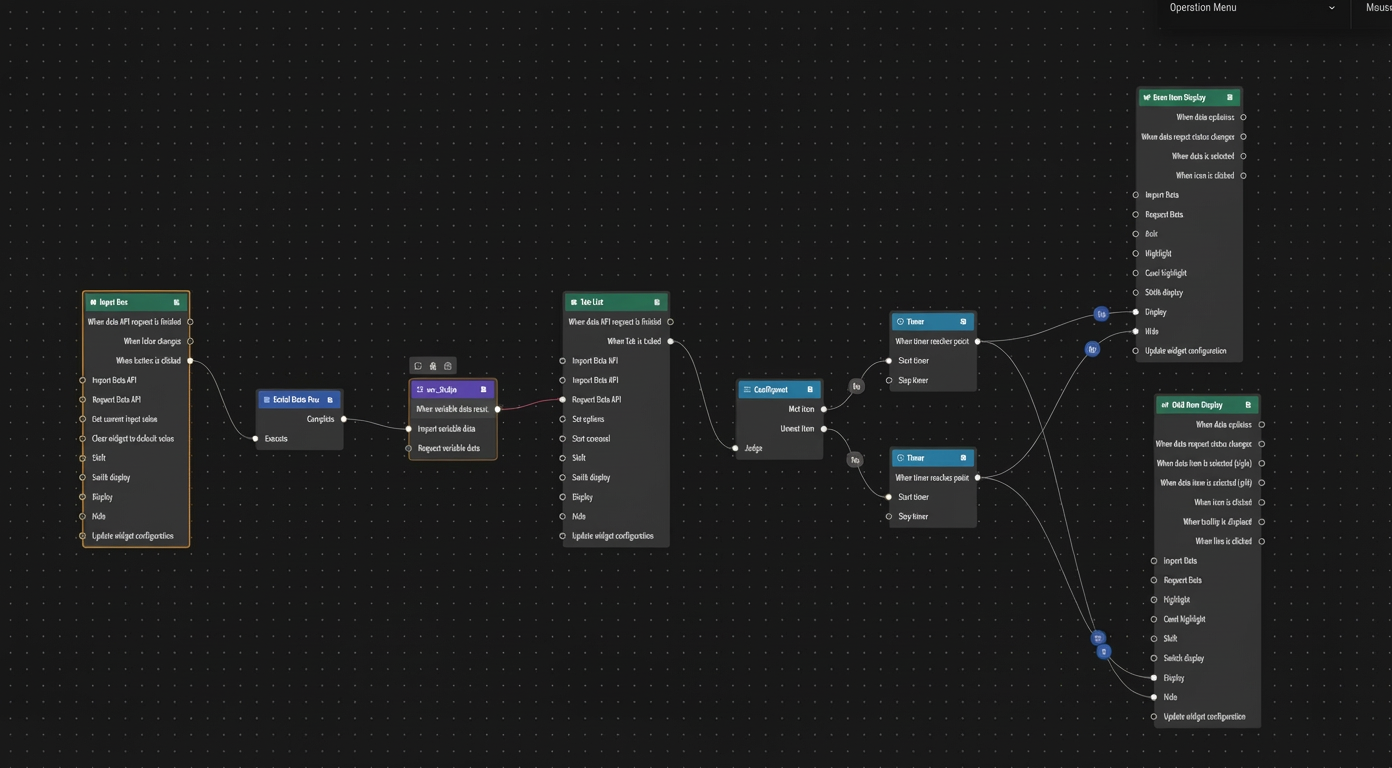
You have configured interactions in the data dashboard. The following figure shows an example of a blueprint configuration.
On the data dashboard editor, open the blueprint debugging window.
In the blueprint debugging window, select a debug object.
Click the drop-down list. You can select a debug object from the tabbed list of widgets and variables.
After you select a debug object, the canvas centers on that node and displays its interaction path.
NoteThe interaction path is displayed as a tree structure. The upstream path shows only the directly associated first-level parent node. The downstream path shows all downstream interaction paths.
You can filter upstream and downstream paths by selecting multiple nodes in the graph or from the drop-down list.
The graph nodes allow you to quickly navigate to the following features:
View interaction configuration: For nodes configured in the widget interaction pane, you can quickly navigate to the interaction configuration.
View variables: For all variables, you can quickly navigate to the related configuration.
Go to blueprint: For all nodes, you can go to the blueprint.
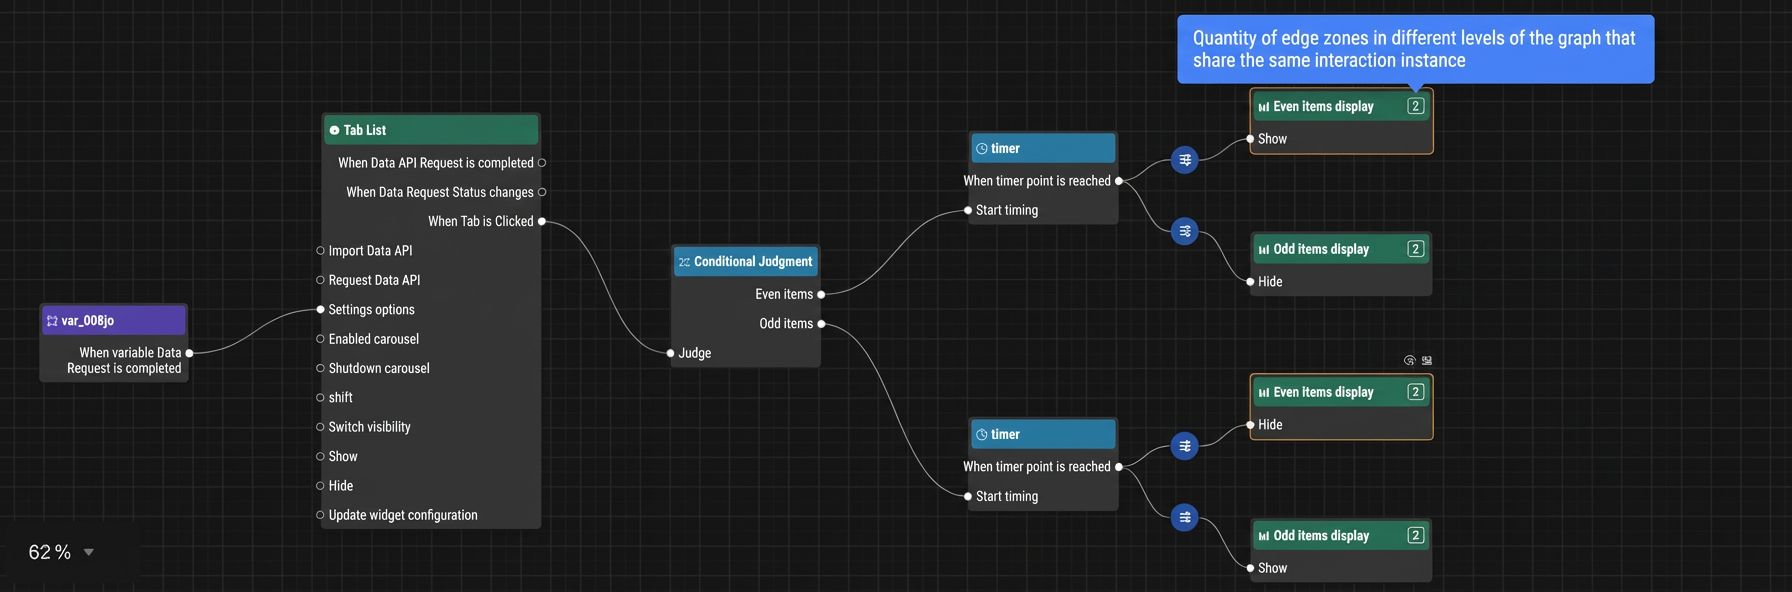
The debug graph uses a tree structure to show the interaction path. Each descendant node can have only one parent node. This structure maintains a clear hierarchy. When an interaction instance is shared by multiple paths, the graph displays it as multiple replica nodes. If you hover over one replica node, all nodes that belong to the same interaction instance are highlighted.

The following are scenarios with multiple replicas:
A blueprint node instance has multiple different sources, as shown in the preceding figure.
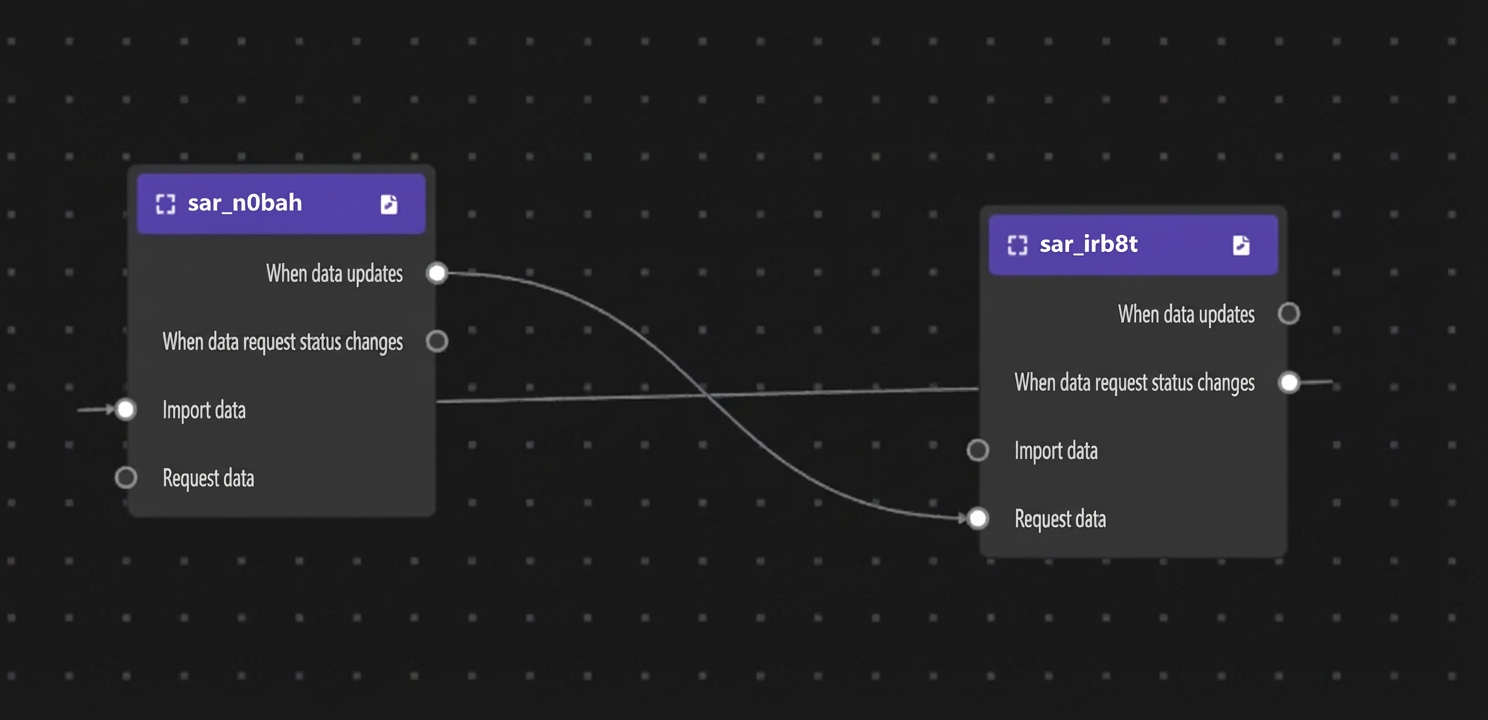
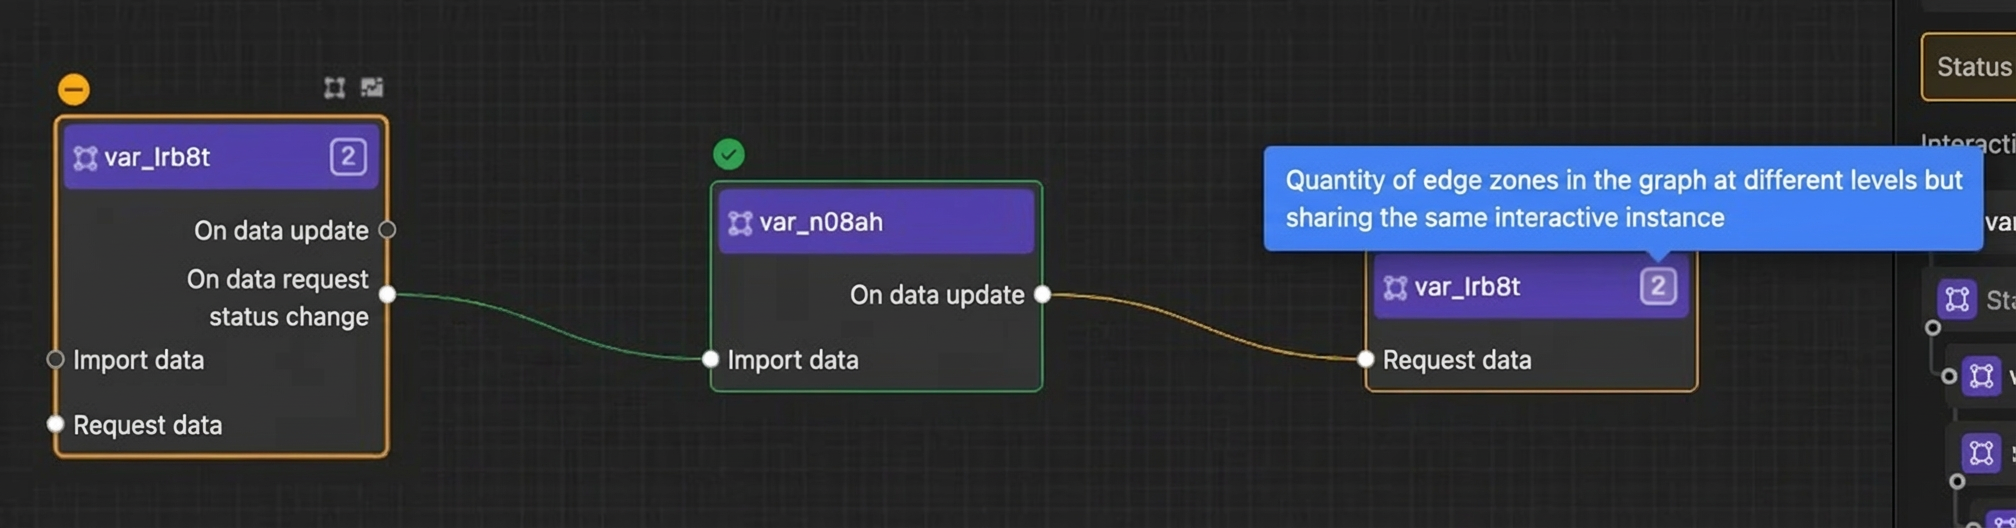
A loopback occurs, and the loop is broken in the view:
The loopback structure in the blueprint editor is as follows:
The blueprint debugging view is as follows:
Initiate debugging
After you select a debug object, you can initiate debugging in two ways:
Method 1: Initiate from the canvas. You can directly interact with page elements to trigger related events.
Method 2: In the interaction debug canvas, hover over a node's anchor point, enter the event or action parameters, and then click the Run Debug button to trigger the related event or action.
NoteThe node's anchor point is pre-filled with the parameters from the last debug session.
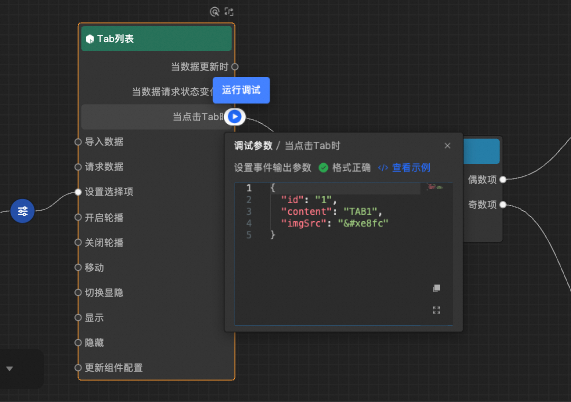
View debug results
Real-time debug results
When you select the current debug node, the debug content is displayed in real time in the right-side pane. The debug graph also shows the debug status.
View action/event parameters
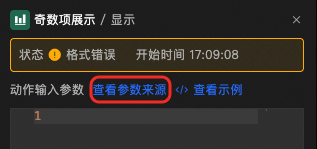
Trace parameter source
You can trace the parameter source to further locate issues. The navigation logic for tracing is as follows:
The trace starts from the current parameter and goes backward, comparing level by level, until a change in the parameter is found.
The system selects the last record at the same level in the trace path.
The system determines if the record can be rendered in the widget interaction pane.
The interaction panel opens if available. Otherwise, you are redirected to the blueprint.
Debug history
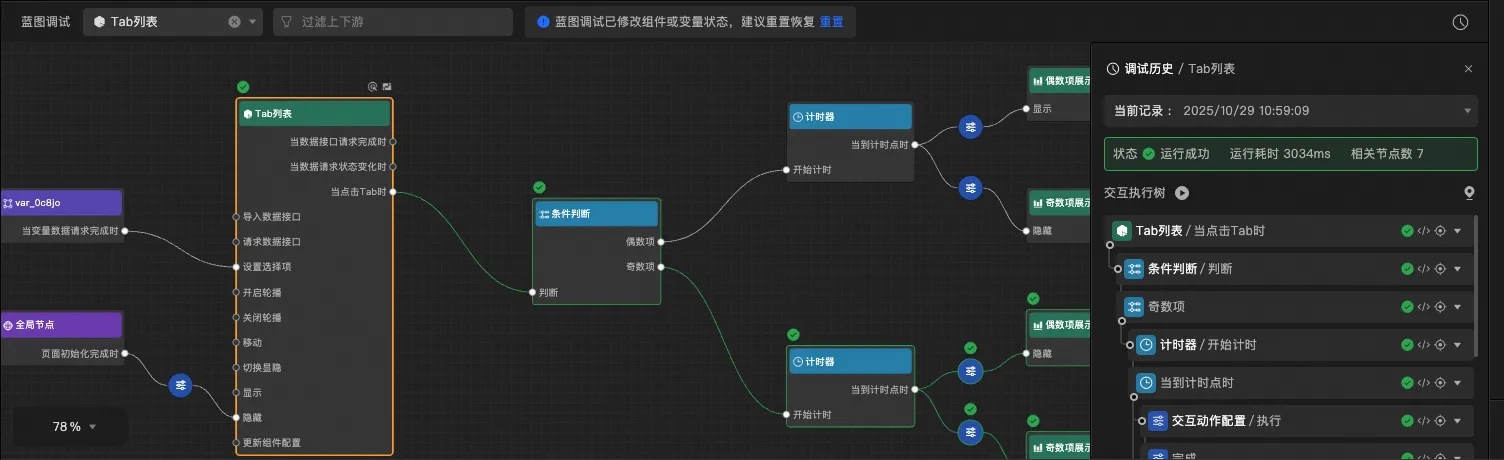
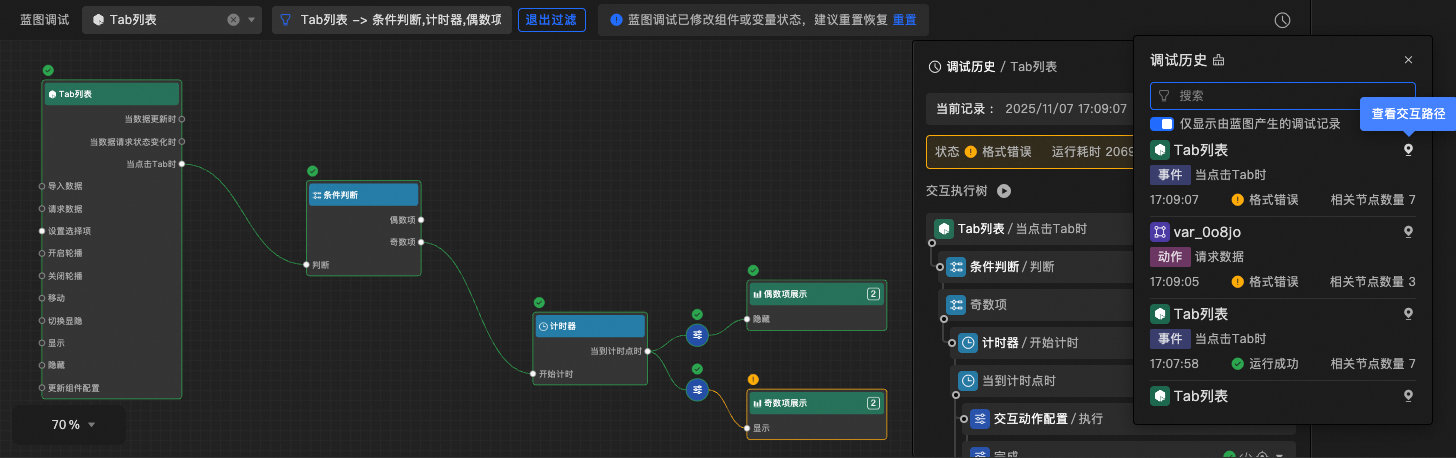
Global debug history: You can view the complete debug history from the upper-right corner and select a target record to locate it.
By default, only debug records for events that are bound to a valid action are displayed. Events without a bound action are not shown.
After you locate a record, the view switches to the root vertex of that interaction record and filters out irrelevant interaction paths. The following figures show a comparison of the view before and after filtering:
View debug history by node
When you select a node, the latest debug record is displayed on the right. You can switch to view other historical records.
If the selected node is not the root vertex of the current execution record, a View Full Execution Process button is displayed.
Reset debug status
Reversible states: The following changes that occur during debugging can be rolled back using this operation: changes to widget style, position, or visibility, and changes to widget or variable data.
Irreversible states: Some states are maintained by the widget instance and can only be restored by refreshing the page.