Choropleth layer
The choropleth layer renders area boundaries and heat-map styles on the 3D globe using GeoJSON data. This topic covers each configuration item of the choropleth layer.
Chart style
The choropleth layer is a subcomponent of the 3D globe that supports independent style and data configuration. It uses GeoJSON data to display area boundaries and render region-specific styles, which is suitable for visualizing geographic data on the 3D globe.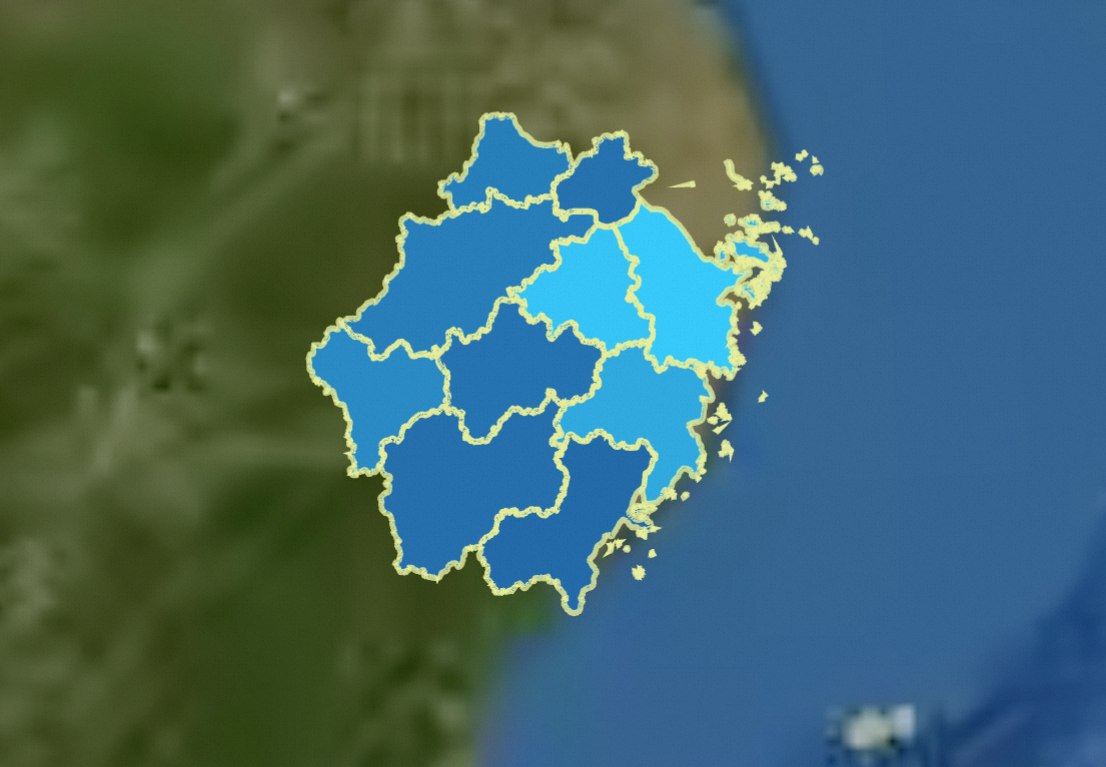
Style panel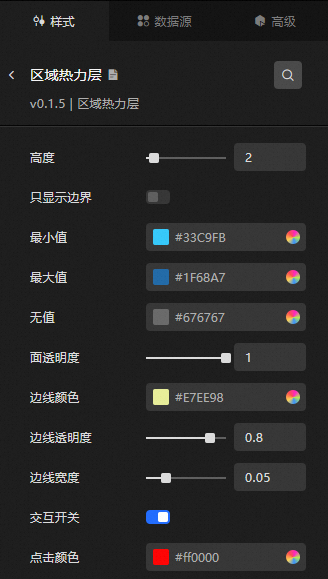
-
Search Configuration: Click the Style icon
 in the upper right corner of the panel to enter the name of the configuration item you wish to locate in the search field. The system supports fuzzy matching. For more information, see Search configuration item.
 -
Height: The relative height of the choropleth layer within the sphere layer. Valid values: 1.5 to 10.
-
Show Only Borders: When enabled, only boundary lines are displayed. When disabled, both area surfaces and boundary lines are shown, with customizable styles.
-
Minimum Value: The color assigned to the area with the smallest value. For modifications, see the color picker description.
-
Maximum Value: The color assigned to the area with the largest value.
-
No Value: The color for areas without data, where the corresponding adcode is missing in the geographic boundary data.
-
Surface Transparency: The transparency of the area surfaces.
-
Border Color: The color of the area boundary lines. For modifications, see the color picker description.
-
Border Transparency: The transparency of the boundary lines. Valid values: 0 to 1.
-
Border Width: The width of the boundary lines. Valid values: 0 to 0.2.
-
Interaction Switch: When enabled, you can set the highlight color that appears when an area is clicked.
Data source panel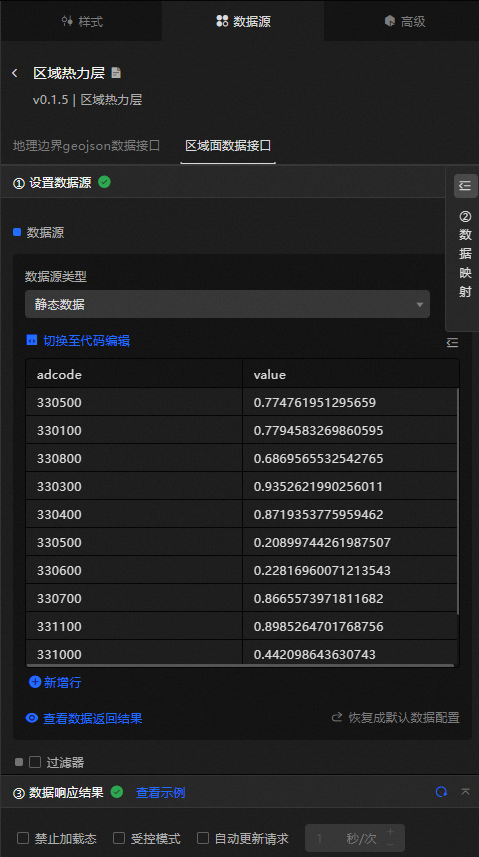
-
Geographic Boundary Geojson Data Interface: Applies extracted GeoJSON boundary data to DataV. The configuration is similar to that of the Basic Flat Map component's Choropleth Layer. For more information, see the data source panel.
-
Area Surface Data Interface
Field
Description
adcodeThe adcode of the area.
valueThe area value, used together with the Maximum Value, Minimum Value, and No Value settings to determine the area color.
NoteThe color gradient from maximum to minimum is calculated based on the value range in the data.
|
Data Item Configuration |
Description |
|
Data Source |
The component's data source displays the data fields contained within the component using code editing or visual editor. You can also modify the data type to flexibly configure the component's data. |
|
Data Mapping |
When you need to customize chart field configurations, you can set different field mappings in the Data Mapping module to map these fields to the corresponding fields of the component. This allows for real-time data matching without altering the data source fields. Additionally, click the |
|
Filter |
Open the Filter to select an existing data filter or create a new one, and configure the data filter script to achieve data filtering capabilities. For more information, see manage data filters. |
|
Data Response Result |
This feature displays the component's data in real-time. When the component's data source changes, the data response result will display the latest data accordingly. In case of a delayed system response, you can click the |
|
Disable Loading State |
Check the check box to hide the loading content during component updates and data dashboard previews. Unchecking will display the loading content. The default setting is unchecked. |
|
Controlled Mode |
Check the check box to prevent data requests upon the component's initialization. Data requests will only be initiated through global variables or methods configured in the blueprint editor. Unchecking allows for automatic update requests. The default setting is unchecked. |
|
Automatic Update Request |
Check the check box to manually set the polling frequency for dynamic polling. Clearing this option disables automatic updates, requiring manual page refreshes or data request triggers through the blueprint editor and global variable events for updates. |
 icon to configure field styles individually.
 icon on the right to check the current data response result, or click the
  icon on the right to obtain the most recent data for the component. You can also click to view examples to see sample response results for the current component.
Advanced panel
When the interaction feature is enabled, a data request is triggered and a temporary variable is emitted when an area is activated or its activation is resumed. This enables dynamic loading of different area data. For details, see component interaction configuration.
Blueprint interaction
-
Click the
 icon in the upper left corner of the page to access the Blueprint page.
 -
In the Layer Node tab, add the current component to the main canvas.
-
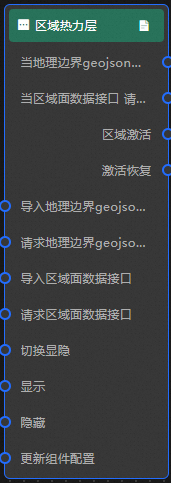
Review the blueprint configuration parameters.
-
Event
Event
Description
When The Geographic Boundary Geojson Data Interface Request Is Completed
Triggered after the geographic boundary GeoJSON data request completes and the filter processes the data. The processed JSON data is emitted. For data examples, see the Data Source tab in the component's right configuration panel in the canvas editor, under the Data Response Result section.
When The Area Surface Data Request Is Completed
Triggered after the area surface data request completes and the filter processes the data. The processed JSON data is emitted. For data examples, see the Data source tab in the component's right configuration panel in the canvas editor, under the Data response result section.
Area Activation
Triggered when a specific area is activated. The activation data is emitted.
Activation Recovery
Triggered when the activation of a specific area is resumed. The deactivation data is emitted.
-
Action
Action
Description
Request Geographic Boundary GeoJSON Data Interface
Re-requests data from the server using the data emitted by an upstream data processing node or layer node as parameters. For example, if a choropleth layer uses an API data source
https://api.testand the data provided to the Request Geographic Boundary Geojson Data Interface action is{ id: '1'}, the resulting request URL ishttps://api.test?id=1.Request Surface Data for Area Interface
Re-requests data from the server using the output of an upstream data processing node or layer node as parameters. For example, if a choropleth layer uses an API data source
https://api.testand the Request Area Surface Data Interface action receives{ id: '1'}as input, the resulting request URL ishttps://api.test?id=1.Import Geographic Boundary GeoJSON Data Interface
Imports processed data that matches the component's rendering format and redraws the component without re-fetching from the server. For data examples, see the Data Source tab in the right configuration panel of the canvas editor, under the Data Response Result section.
Import Area Surface Data Interface
Imports processed data that matches the component's rendering format and redraws the component without re-fetching from the server. For data examples, see the Data Source tab in the component's right configuration panel in the canvas editor, under the Data Response Result section.
Toggle Visibility: Toggles the component between visible and hidden. No parameters required.
Toggles the component between visible and hidden. No parameters required.
Show: Makes the component visible. See the data example.
Makes the component visible. See the data example.
{ "animationType": "",//Animation type. Optional value: fade. No animation if not filled. "animationDuration": 1000,//Animation delay in ms. "animationEasing": ""//Animation curve }Hide: Hides the component. See the data example.
Hides the component. See the data example.
{
  "animationType": "",//Animation type. Optional value: fade. No animation if not filled.
  "animationDuration": 1000,//Animation delay in ms.
  "animationEasing": ""//Animation curve
}
Update Component Configuration
Dynamically updates the component's style configuration. Click Copy Configuration To Clipboard in the Style panel to copy the configuration data, then modify the field values in the data processing node on the blueprint editor's configuration page.
-
 icon in the upper left corner of the page to access the Blueprint page.