Area charts
Updated at:
This topic describes the types of area charts and their examples.
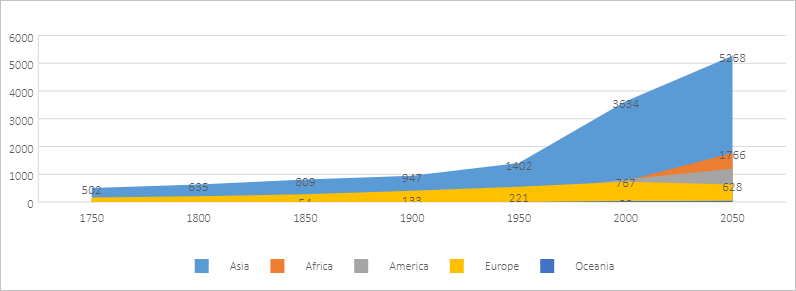
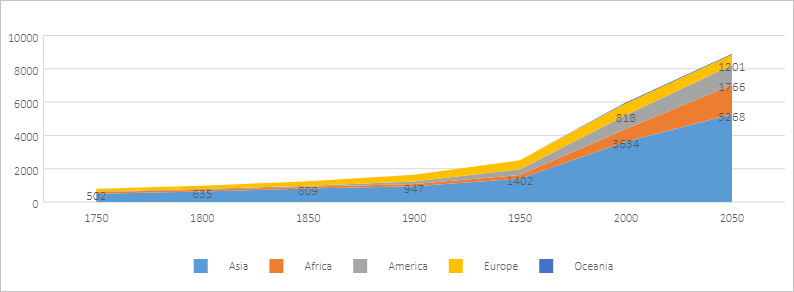
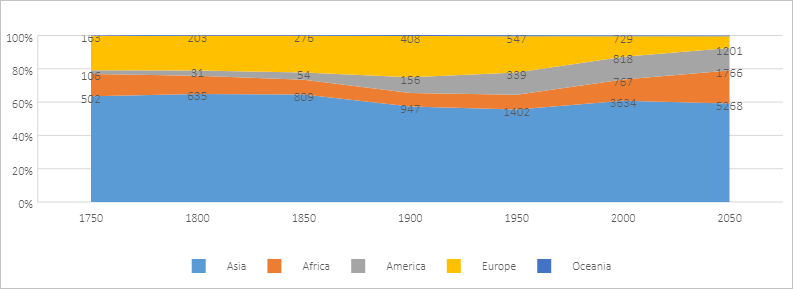
An area chart is a line chart with the areas below the lines filled with colors.
Similar to a line chart, an area chart emphasizes the changes over time, and is used to highlight the change trend. An area chart displays the trend through areas. We recommend that an area chart consist of up to five areas.
This topic uses the sample data listed in the following table to show different types of area charts.
| 1750 | 1800 | 1850 | 1900 | 1950 | 2000 | 2050 | |
| Asia | 502 | 635 | 809 | 947 | 1402 | 3634 | 5268 |
| Africa | 106 | 107 | 111 | 133 | 221 | 767 | 1766 |
| America | 18 | 31 | 54 | 156 | 339 | 818 | 1201 |
| Europe | 163 | 203 | 276 | 408 | 547 | 729 | 628 |
| Oceania | 2 | 2 | 2 | 6 | 13 | 30 | 46 |
- Area chart
- Stacked area chart
- 100% stacked area chart
Is this page helpful?