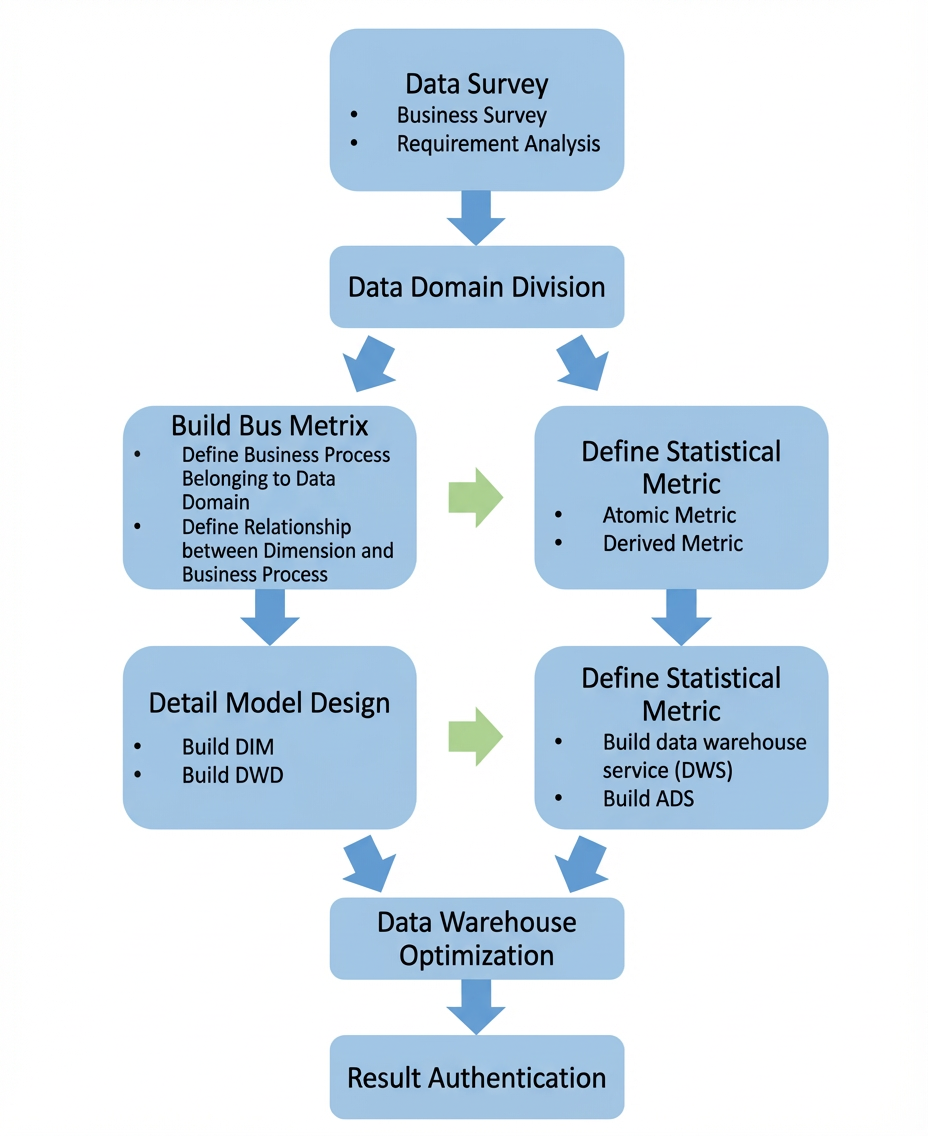
The following figure shows the overall process for building a data warehouse in MaxCompute.
Terms
Before you start this tutorial, familiarize yourself with the following terms:
Business segment: A method for dividing a business at a higher level than a data domain. This method is suitable for large business systems.
Dimension: A concept from the Dimensional Modeling methodology proposed by Ralph Kimball. Dimension-based models are built for analysis and decision-making. A dimension provides context for a measure. It is a perspective for observing a business, such as a category of business properties. A dimension is a collection of properties and can also be called an entity object. For example, in a transaction analysis, dimensions such as buyer, seller, product, and time describe the context of the transaction.
Property (dimension property): A column within a dimension. Dimension properties are used for query constraints, grouping, and report labels. They are key to data usability.
Measure: In Dimensional Modeling, a measure is also known as a fact, and its context is described by dimensions. Dimensions provide the different contexts required to analyze facts. A measure is usually numerical data and acts as a fact in a logical fact table.
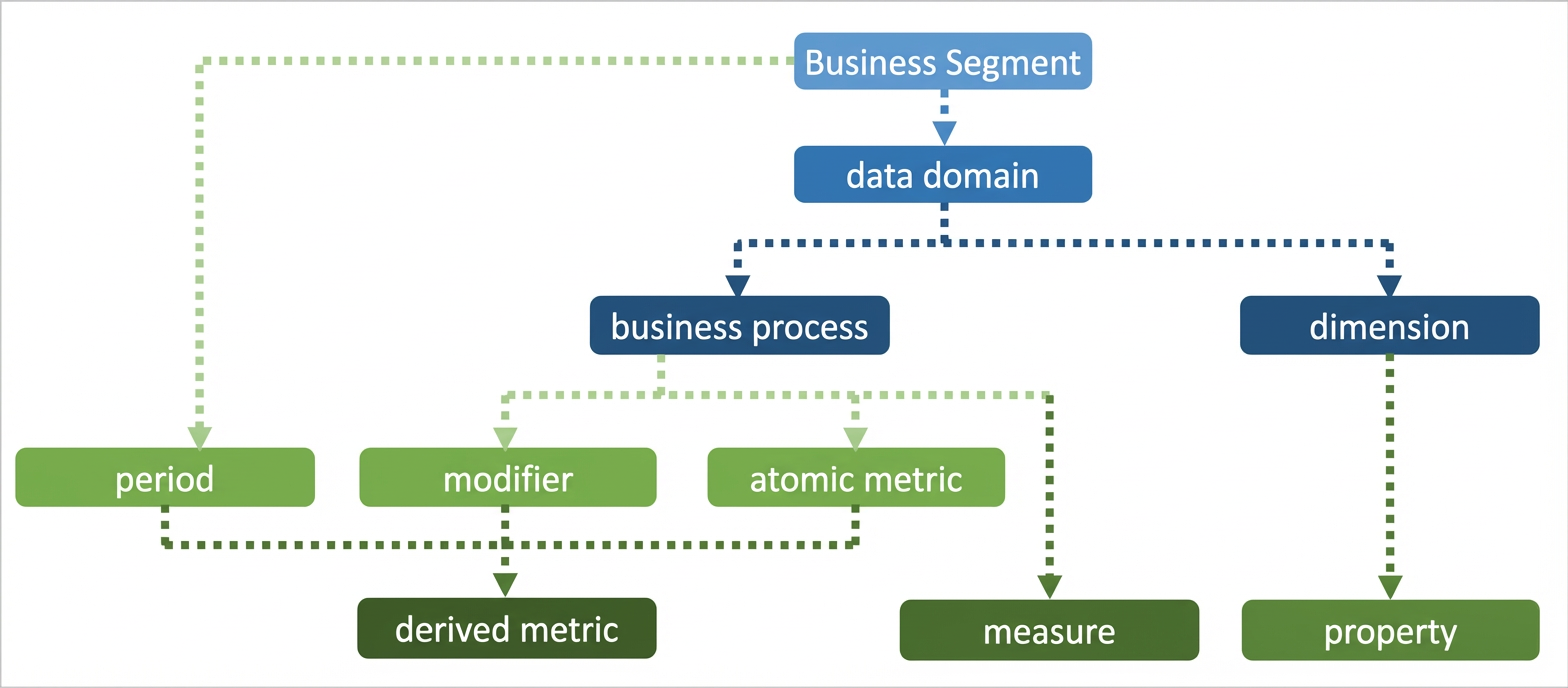
Metric: Metrics are divided into atomic metrics and derived metrics. An atomic metric is a measure of a business event or behavior. It is the most basic, indivisible metric in a business definition. It is a noun with a clear business meaning that defines a statistical scope and calculation logic, such as payment amount.
Atomic metric = Business process + Measure.
Derived metric = Period + Modifier + Atomic metric. A derived metric defines the business statistical scope for an atomic metric.
Business filter: Defines the business scope for statistics. It filters records that match business rules. This is similar to the condition in a where clause in SQL, but does not include a time range.
Statistical period: The time range used for statistics, such as the last day or the last 30 days. This is similar to the time condition in a where clause in SQL.
Statistical granularity: The perspective used for statistical analysis. It defines the required level of data summarization and is similar to the group by clause in an SQL aggregation operation. Granularity is a combination of dimensions that specifies the statistical scope. For example, if a metric measures a seller's transaction volume in a specific province, the granularity is the combination of the seller and region dimensions. If you count data for an entire table, the granularity is the entire table. When you specify the granularity, consider the relationship between the business and its dimensions. Statistical granularity is often used as a modifier for a derived metric.
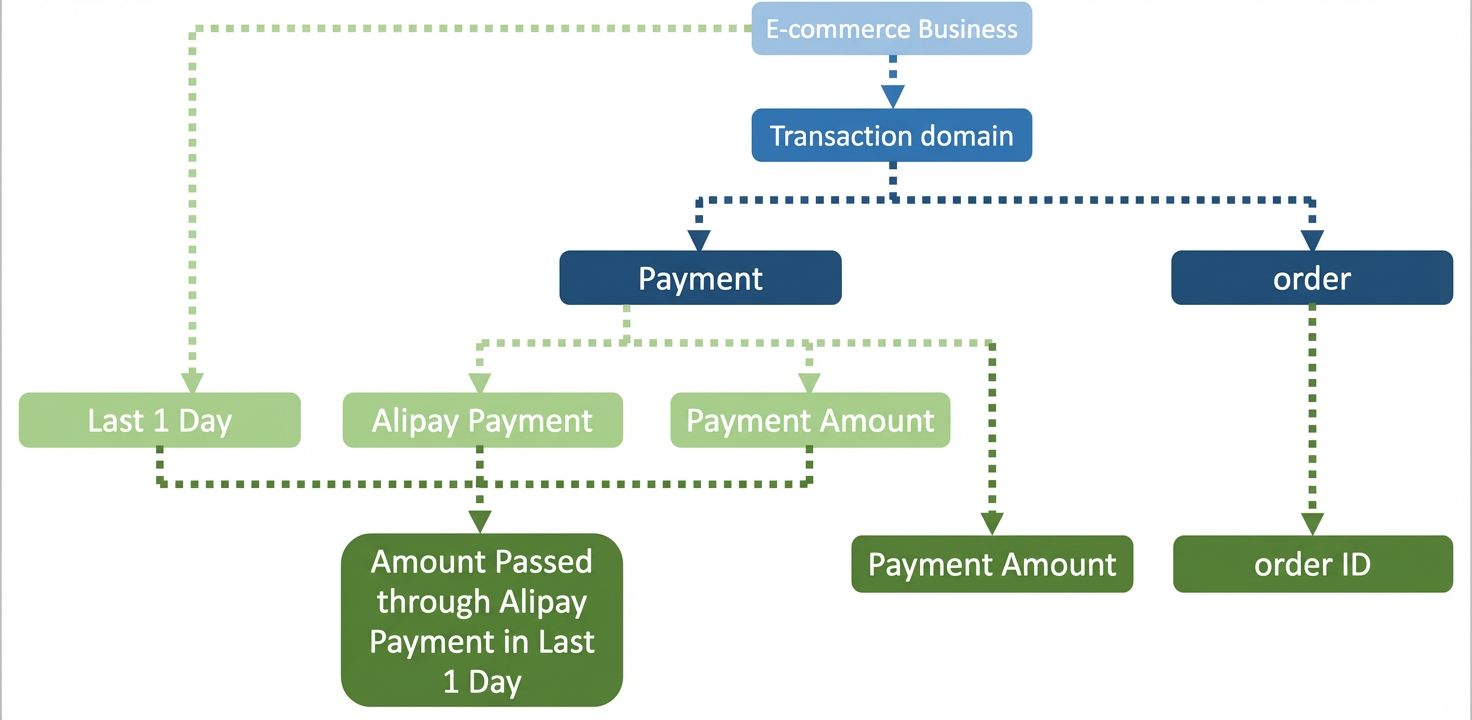
The following figures show the relationship between the terms and examples.