Data modeling
Load data processed in DataWorks into Machine Learning Platform for AI (PAI) and build a model to identify electricity theft and leakage.
Prerequisites
Before you begin, complete the steps in Process data.
Create an experiment
Create and open a blank pipeline. For more information, see Create a custom pipeline.
Load the dataset
-
In the component list on the left, under Data Source/Target, drag the Read Table component to the canvas and rename it to data4ml.
-
Select the data4ml node on the canvas. In the configuration pane on the right, enter
data4mlin the Table Name field. -
Right-click the data4ml node on the canvas and select Run Current Node from the shortcut menu.
-
After the node runs successfully, right-click the data4ml node and select View Data > Source MaxCompute Table Output Port. The loaded data includes indicators for electricity theft and leakage, such as declining power consumption trends, line loss rates, and alert counts, along with a label that indicates actual instances of electricity theft or leakage.
Explore the data
-
Correlation analysis
-
In the component list on the left, under Statistical Analysis, drag the Correlation Coefficient Matrix component to the canvas.
-
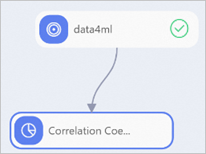
Connect the data4ml node to the Correlation Coefficient Matrix-1 node.
-
Right-click the Correlation Coefficient Matrix-1 node and select Run Current Node from the shortcut menu.
-
After the run completes, right-click the Correlation Coefficient Matrix-1 node and select Visual Analysis from the shortcut menu.
-
-
Feature analysis
-
In the component list on the left, under Statistical Analysis, drag the Data View component to the canvas.
-
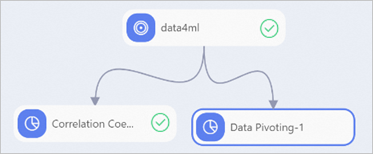
Connect the data4ml node to the Data View-1 node.
-
Select the Data View-1 node on the canvas. In the configuration pane on the right, on the Field Settings tab, set Feature Columns to trend, xiansun, and warnindicator, and set Label Column to flag.
-
Right-click the Data View-1 node and select Run Current Node from the shortcut menu.
-
After the run completes, right-click the Data View-1 node and select Visual Analysis from the shortcut menu to see the data distribution for each feature relative to the label column.
-
Build a data model
After exploratory analysis, select an appropriate algorithm to build a data model.
-
Use the Split component to divide the data into a training set and a test set.
-
In the component list on the left, under Data Preprocessing, drag the Split component to the canvas.
-
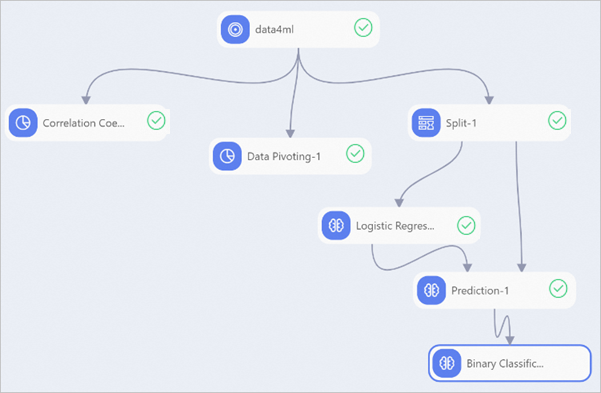
Connect the data4ml node to the Split-1 node.
-
Right-click the Split-1 node and select Run Current Node from the shortcut menu.
-
After the run completes, right-click the Split-1 node and select to view the results.
-
-
Use the Logistic Regression Binary Classification component to train a classification model.
-
In the component list on the left, under Machine Learning Platform For AI > Binary Classification, drag the Logistic Regression Binary Classification component to the canvas.
-
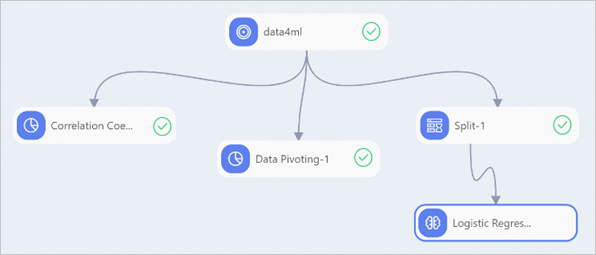
Connect the Output Table 1 port of the Split-1 node to the Logistic Regression Binary Classification-1 node.
-
Select the Logistic Regression Binary Classification-1 node on the canvas. In the configuration pane on the right, on the Field Settings tab, set Feature Columns to trend, xiansun, and warnindicator, and set Label Column to flag.
-
Right-click the Logistic Regression Binary Classification-1 node and select Run Current Node from the shortcut menu.
-
After the run completes, right-click the Logistic Regression Binary Classification-1 node and select Model Options > Model Description to view the model details.
-
Make predictions and evaluate the model
-
Use the Prediction component to generate predictions on the test set.
-
In the component list on the left, under Machine Learning Platform For AI, drag the Prediction component to the canvas.
-
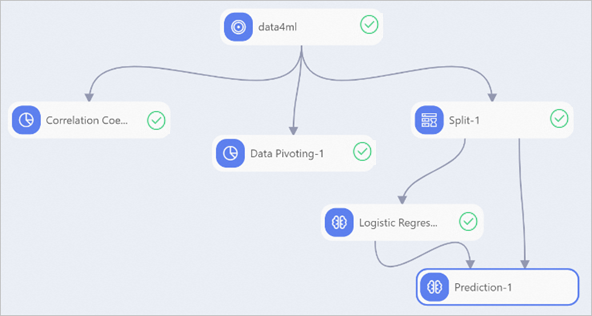
Connect the Logistic Regression Model port of the Logistic Regression Binary Classification-1 node to the Model Input port of the Prediction-1 node. Then, connect the Output Table 2 port of the Split-1 node to the Prediction-1 node's Prediction Data Input port.
-
Select the Prediction-1 node on the canvas. In the configuration pane on the right, on the Field Settings tab, leave all columns selected by default for Feature Columns. Set Passthrough Columns to uid, trend, xiansun, warnindicator, and flag.
-
Right-click the Prediction-1 node and select Run Current Node from the shortcut menu.
-
After the run completes, right-click the Prediction-1 node and select View Data > Prediction Result Output from the shortcut menu to view the results.
-
-
Use the Binary Classification Evaluation component to assess the model's performance.
-
In the component list on the left, under , drag the Binary Classification Evaluation component to the canvas.
-
Connect the Prediction-1 node to the Binary Classification Evaluation-1 node.
-
Select the Binary Classification Evaluation-1 node on the canvas. In the configuration pane on the right, on the Field Settings tab, set Original Label Column to flag.
-
Right-click the Binary Classification Evaluation-1 node and select Run Current Node from the shortcut menu.
-
After the run completes, right-click the Binary Classification Evaluation-1 node and select Visual Analysis from the shortcut menu to view the evaluation report.
-
Next steps
After building the model, use EAS Online Deployment to deploy it as an online service for real-time predictions.