The performance of MaxCompute is highly dependent on compliant table design. To measure the performance of your MaxCompute tables, establish a performance baseline before you begin optimization.
For more information, see Table design specifications.
Test the system performance before and after table optimization. For each table, record the data synchronization time, storage size, and query performance details. If you use subscription resources for your MaxCompute project, also record the number of purchased resources.
Test item |
Test value |
Data synchronization time |
None |
Storage size |
None |
Query running time |
None |
Estimated query cost |
None |
Record the data synchronization time
After a data synchronization task runs, right-click the task on the page to view its running time.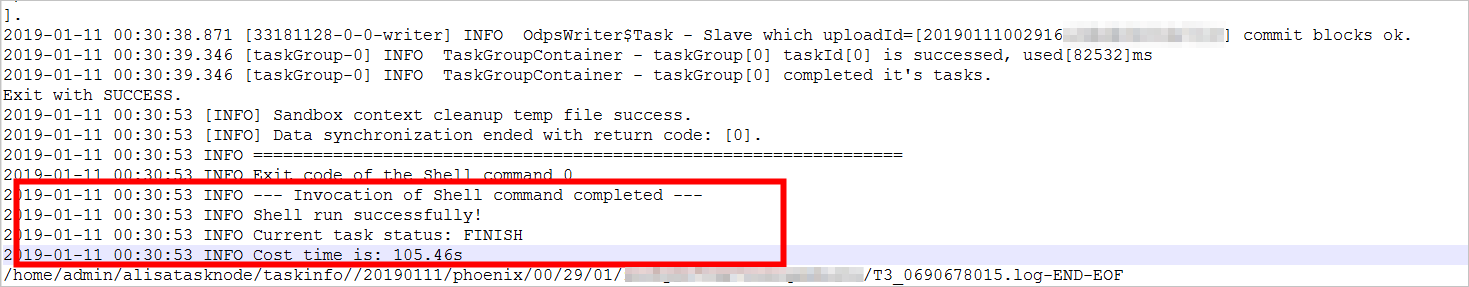
Record the storage size
Log on to the DataWorks console.
You can use the describe command to view the physical storage size of an entire table or a specific partition. For more information, see DESC TABLE/VIEW.
Record the query running time and estimated cost
Log on to the DataWorks console, go to the DataStudio page, and create an ODPS SQL node.
You can view the estimated cost on the page when you run the task or by clicking the ![]() icon. After the task is complete, you can view the running time in the operational log.
icon. After the task is complete, you can view the running time in the operational log.