Application overview
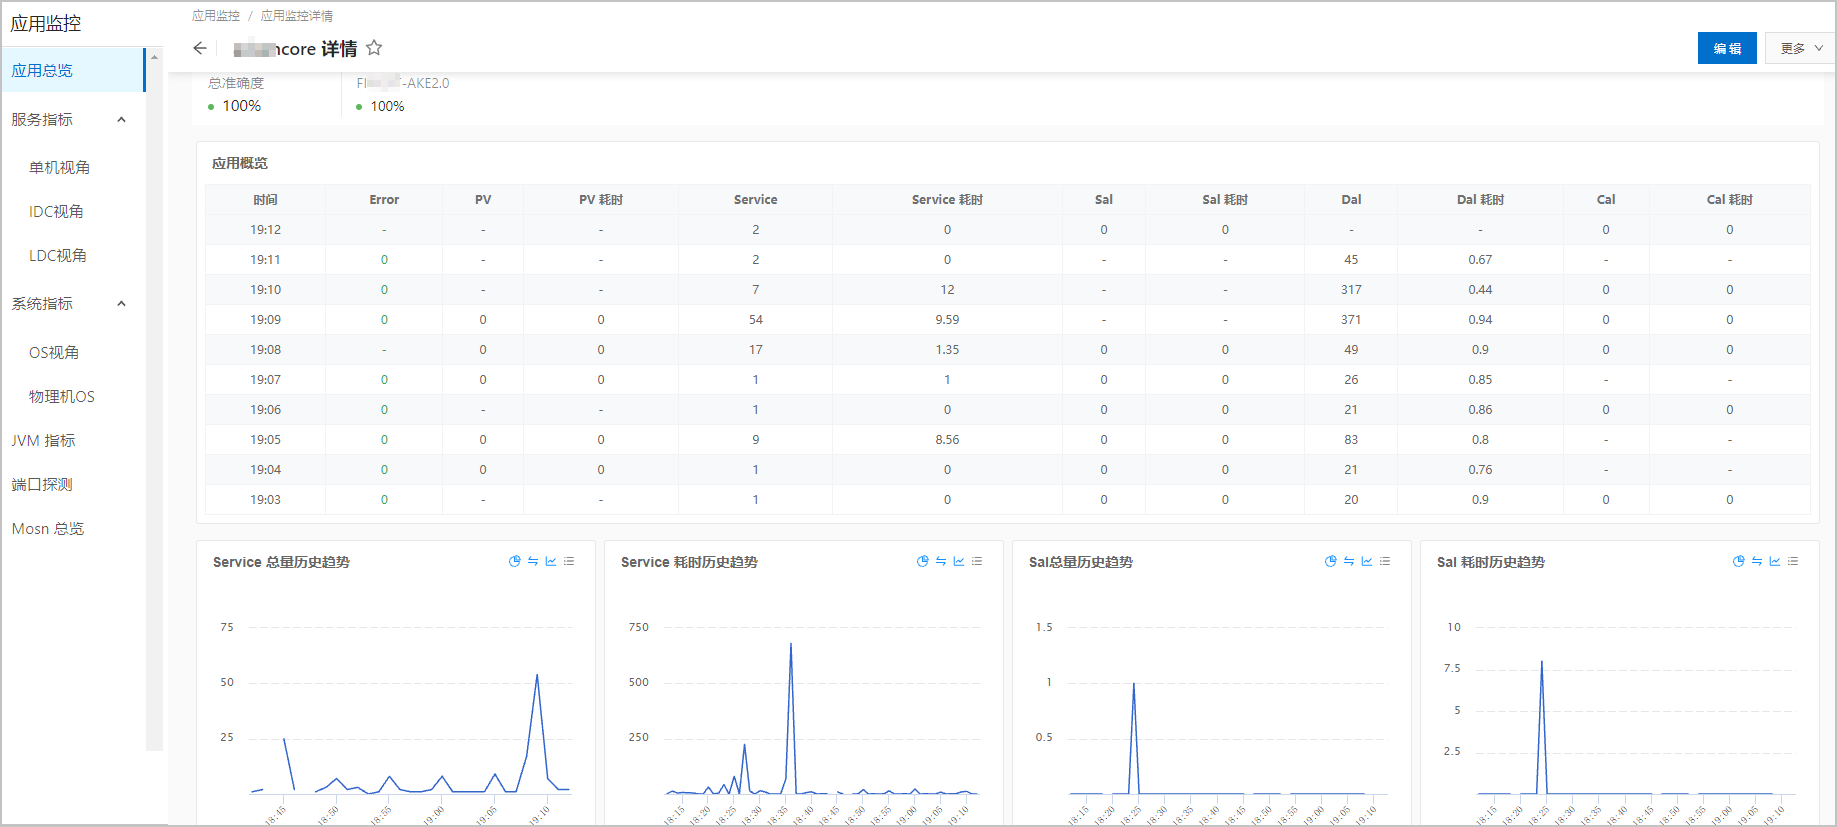
The application monitoring feature of Real-time Monitoring Service (RMS) allows you to analyze applications. You can view and analyze all application monitoring data on the Application Monitoring page. You can aggregate application-related service metrics, such as Error, Service, SAL, CAL, DAL, OS, JVM, CE Thread, MOSN, and port data, and system metrics, such as metrics related to CPU, memory, and disks. Then, you can perform comparative analysis on the metric data based on spatial distribution and temporal distribution of Internet data centers (IDCs), logical data centers (LDCs), and single machines. The following key metrics are provided:
Error: the number of system errors
PV: the number of page views (PVs)
Service: the number of requests from external applications to call the current application
SAL: the number of requests from the current application to call external applications
DAL: database access
SQL time consumption
System metrics
Availability (port)
MOSN metrics
Set query conditions
You can set the following query conditions:
Enter or reset the regular expression for filtering.
Select a comparison curve and a time span.
Replay: displays data generated in a specified period of time.
Automatic Update: refreshes data on the page at a scheduled time.
Edit the Overview page
You can click Edit to customize the configuration and add an alert package. The following figure shows an example.
RMS automatically identifies the encoding format for logs. Generally, you do not need to manually set the Log Encoding parameter.
Custom configuration
You can set the following metrics:
Collect Log File
Add Whitelist Filtering or Add Blacklist Filtering
Cache Source
Results
Total
Time Consumed
The following table describes the key metrics.
Metric |
Description |
Calls to the cache service-CAL |
The related metrics are used to monitor the access of applications to the cache. The following configuration requirements must be met:
|
Calls to database services-DAL |
The related metrics are used to monitor the access of applications to databases. The following configuration requirements must be met:
|
Error-error |
The number of system errors. The metric is used to monitor the number of error logs in the current application and show the trend of errors. On the Application Monitoring page, you can click an error to view related logs. The following configuration requirements must be met:
|
System monitoring-system |
The related metrics are used to monitor resources on the virtual machine or Elastic Compute Service (ECS) instance in which the current application resides. The metrics include the CPU utilization, load, and memory usage. The following configuration requirements must be met:
|
PV-pv |
The number of page views. The metric is used to monitor the number of calls to pages in the current application. The following configuration requirements must be met:
|
Calls to external services-SAL |
The related metrics are used to monitor the calls from the current application to other services. The following configuration requirements must be met:
|
Calls to the current application-service |
The number of requests from external applications to call the current application. The related metrics are used to monitor the access of other applications to the current application. The following configuration requirements must be met:
|
SQL time consumption detection-sql |
The metric is used to monitor the execution of SQL statements when the current application accesses databases, including identifying slow SQL queries. The following configuration requirements must be met:
|
Flow Limit-flowlimit |
The metric is used to monitor traffic. |
Message publishing-msgpub |
The metric is used to monitor message publishing. |
Message subscription-msgsub |
The metric is used to monitor message subscriptions. |
JVM monitoring-jvmgc |
The metric is used to monitor JVM. |
Port detection-checkservice |
The metric is used to monitor port detection. |
Calls to MOSN application services-mosnservice |
The metric is used to monitor the calls to MOSN application services.
Note
The mosnservice metric is the same as the Mesh Sidecar metric. |
Calls to external application services by MOSN-mosnsal |
The metric is used to monitor the calls from MOSN to external services. |
Subscription to MOSN messages-mosnmsgsub |
The metric is used to monitor the subscription to MOSN messages. |
Publishing of MOSN messages-mosnmsgpub |
The metric is used to monitor the publishing of MOSN messages. |
MOSN Error-mosnerror |
The metric is used to monitor MOSN errors. |
OB Proxy metric-odpstat |
The metric is used to monitor the OceanBase proxy. |
ODP exception-odperror |
The metric is used to monitor Open Database Proxy (ODP) exceptions. |
MOSN metric data |
The metric is used to monitor MOSN metric data. |
ibmmqput-ibmmqput |
The metric is used to monitor Put requests in IBM messages. |
ibmmqget-ibmmqget |
The metric is used to monitor Get requests in IBM messages. |
Alert Package
You can click a specific metric in the alert metrics to add an alert package.
You must set the following parameters when you add an alert package:
Alert Package Name
Custom Alert Time Zone
Alert Level
Different monitoring metrics have different alert conditions. The following table describes the mapping between metrics and alert conditions.
Metric |
Alert Condition |
Calls to the cache service-CAL |
Cache sources, total LDCs, total IDCs, total applications, servers, and application instances |
Calls to database services-DAL |
Total applications, total LDCs, total IDCs, data sources, servers, and application instances |
Error-error |
Total applications, total LDCs, total IDCs, servers, and application instances |
System monitoring-system |
Total applications, total LDCs, total IDCs, servers, application instances, service IDCs, and IP addresses of single machines |
PV-pv |
Total applications, total LDCs, total IDCs, total URLs, servers, and application instances |
Calls to external services-SAL |
Total applications, total IDCs, total LDCs, destination applications, API method details, servers, application instances, and API method details of downstream applications |
Calls to the current application-service |
Total applications, total LDCs, total IDCs, API method details, source applications, servers, and application instances |
SQL time consumption detection-sql |
Top applications |
Flow Limit-flowlimit |
Total applications, total LDCs, total IDCs, and servers |
Message publishing-msgpub |
Total applications, total LDCs, total IDCs, total topic eventcodes, servers, and application instances |
Message subscription-msgsub |
Total applications, total LDCs, total IDCs, total topic eventcodes, servers, and application instances |
JVM monitoring-jvmgc |
Single machines, total applications, IDCs, LDCs, and application instances |
Port detection-checkservice |
Total applications, servers, application ports, and ports on single machines |
Calls to MOSN application services-mosnservice |
Total applications, total LDCs, total IDCs, servers, and API method details |
Calls to external application services by MOSN-mosnsal |
Total applications, total IDCs, total LDCs, servers, and API method details of downstream applications |
Subscription to MOSN messages-mosnmsgsub |
Total applications, total LDCs, total IDCs, servers, and total topic eventcodes |
Publishing of MOSN messages-mosnmsgpub |
Total applications, total LDCs, total IDCs, servers, and total topic eventcodes |
MOSN Error-mosnerror |
Total applications, total LDCs, total IDCs, and servers |
OB Proxy metric-odpstat |
Total applications, total IDCs, IDCs, sing machines, data sources, SQL types, and total error codes |
ODP exception-odperror |
Total applications, total LDCs, total IDCs, and servers |
MOSN metric data |
N/A |
ibmmqput-ibmmqput |
Total applications and queue dimensions |
ibmmqget-ibmmqget |
Total applications and queue dimensions |
Subscribe to alerts
On the Subscribe to Alerts page, you can create alert subscriptions or modify existing alert subscriptions.
When you create an alert subscription, you must set the following parameters:
Subscriber: Select a subscriber.
Alert Level:Valid values: All Subscriptions, P0, P1, P2, P3, and P4.
Lower Notification Downgrade: Valid values: Enable or Close. Default value: Enable. If an alert is continuously triggered, the frequency of sending alert notifications decreases from every 1 minute, every 2 minutes, every 5 minutes, every 10 minutes, every 30 minutes, to every 60 minutes. An alert notification is sent twice every minute, twice every 2 minutes, three times every 5 minutes, five times every 10 minutes, five times every 30 minutes, and then once every hour.
Disable or enable the alert feature
On the Pause/Resume Alert page, you can specify the length of time for disabling the alert feature and the reason why you disable it. The following figure shows an example.
On the Add Tag page, you can add a tag. The following figure shows an example.
Alert history
On the Alert History page, you can query the alert history. The following figure shows an example.