H5 performance
Monitor key metrics for your app's H5 pages, including overall page views (PV), page load duration, slow loading ratio, JS errors, and blank screen rate. You can also monitor JS exceptions for your H5 pages.
Follow these steps to view the H5 performance analysis report:
Log on to the console, navigate to Products & Services > Mobile PaaS (mPaaS), and then select your application.
In the left-side navigation pane, choose Performance Monitoring > H5 Performance.
On the H5 Performance page, select the platform, application version, and time range. Then, click the H5 Performance Analysis or JS Error Monitoring tab.
NoteH5 Performance supports iOS, Android, and HarmonyOS platforms.
To export the analysis report, click Export Data in the upper-right corner of the page.
H5 performance analysis
This section displays basic performance statistics and trends for your app's H5 pages across four metrics: page load duration, slow loading ratio, JS errors, and blank screen rate. The H5 Performance Analysis feature consists of two parts: Performance Analysis and Performance Details.
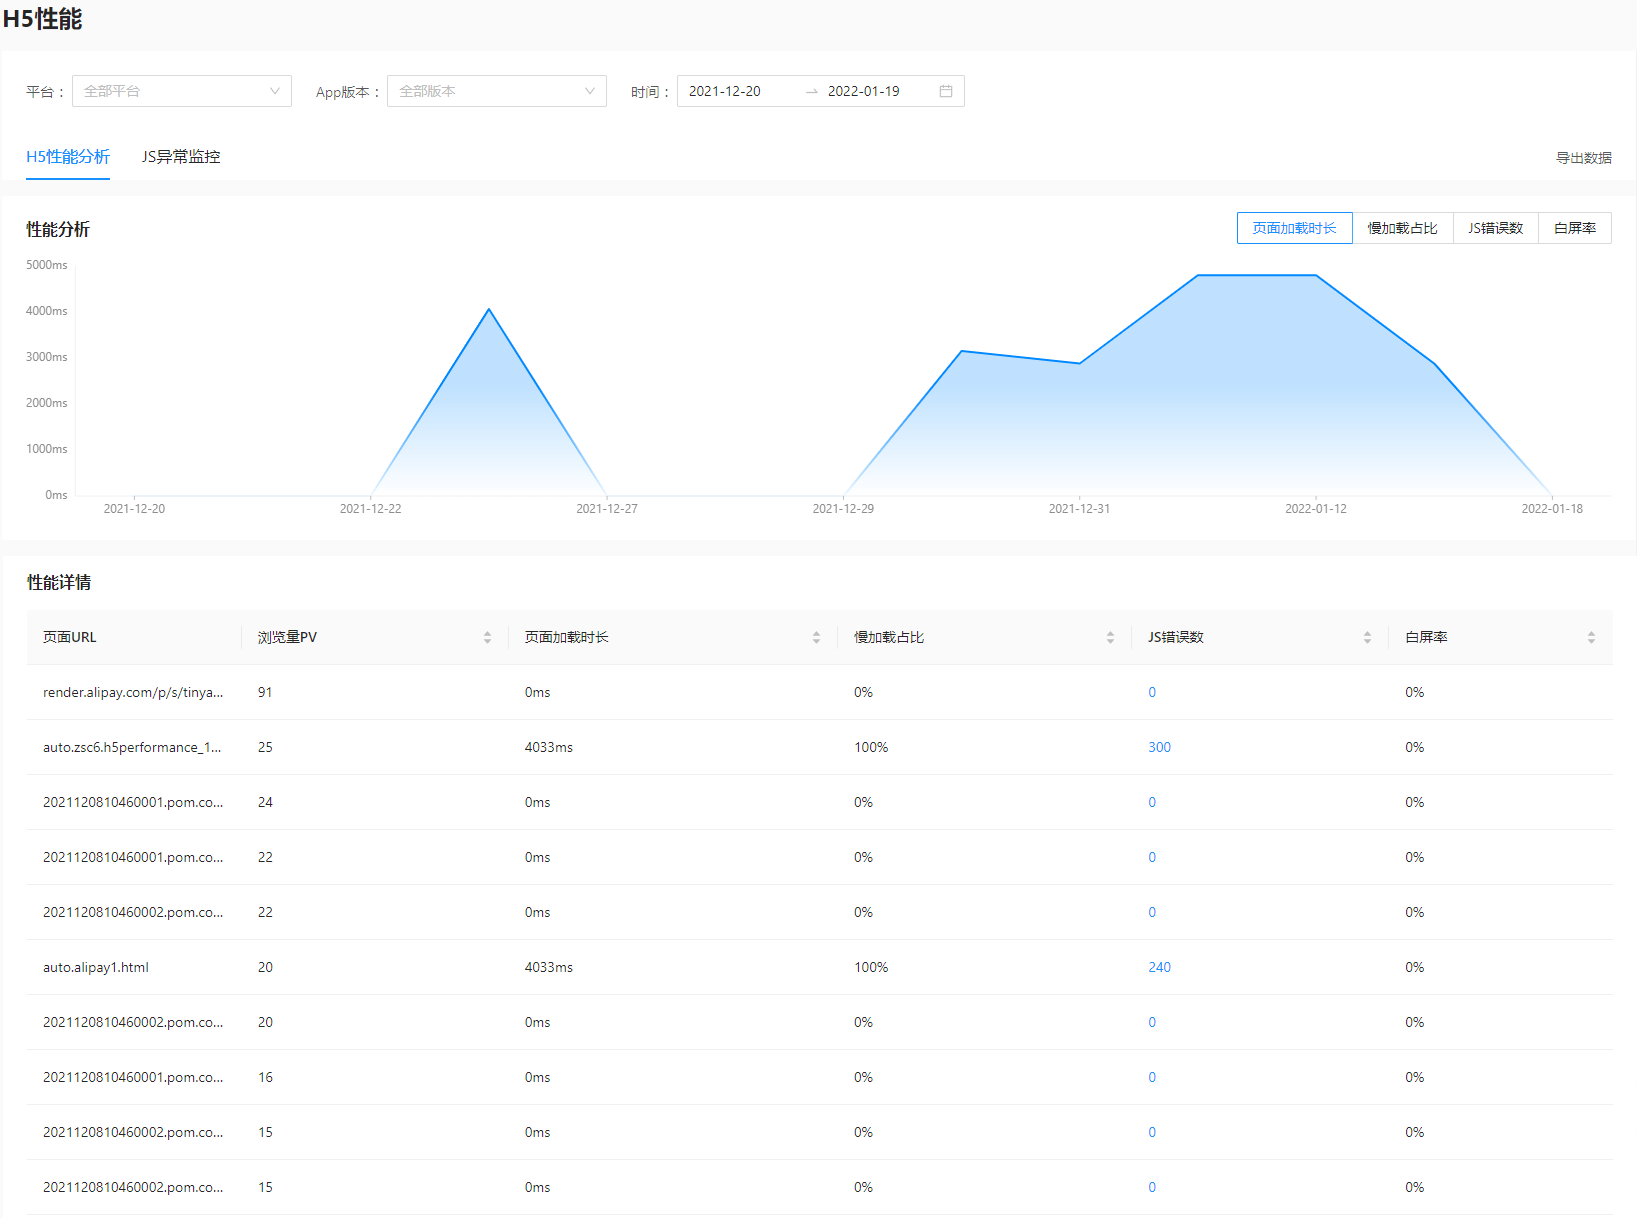
Performance Analysis
This section shows trends for H5 page performance metrics. The following table describes each metric:
Metric
Description
Page load duration
The average time it takes for all H5 pages to load within the specified time range. It is the time elapsed from when a page starts loading to when it finishes loading, measured in milliseconds (ms), and is a key metric for application usability.
Slow loading ratio
The percentage of page views that take longer than 2 seconds to load.
JS errors
The total number of JS errors that occurred within the specified time range.
Blank screen rate
The percentage of page views that result in a blank screen (a page with no content).
Performance Details
This section displays performance data for each H5 page visited in your app. You can sort the data by page views (PV), page load duration (ms), slow loading ratio, or JS errors. In the Performance Details list, click the value in the JS errors column to go to the JS Error Monitoring page and view the exception details.
Metric
Description
Page views (PV)
The total number of times the H5 page was viewed within the specified time range.
Page load duration
The average time it takes for this H5 page to load within the specified time range. Page load duration is the time elapsed from when a page starts loading to when it finishes loading. It is a key metric for application usability and is measured in milliseconds (ms).
Slow loading ratio
The percentage of views for this H5 page that took longer than 2 seconds to load.
JS errors
The total number of JS errors that occurred on this page within the specified time range. Click the error count to view the JS exception details for this H5 page.
Blank screen rate
The percentage of views for this page that resulted in a blank screen (a page with no content).
JS error monitoring
This feature monitors and displays H5 pages with JS exceptions in real time, showing the last report time and the number of occurrences for each exception. This helps you quickly locate the source of JS errors. You can view all JS exceptions for all pages or for a specific page, and sort the exception list by the last report time.
To export the exception page data, click Export Data in the upper-right corner of the list.
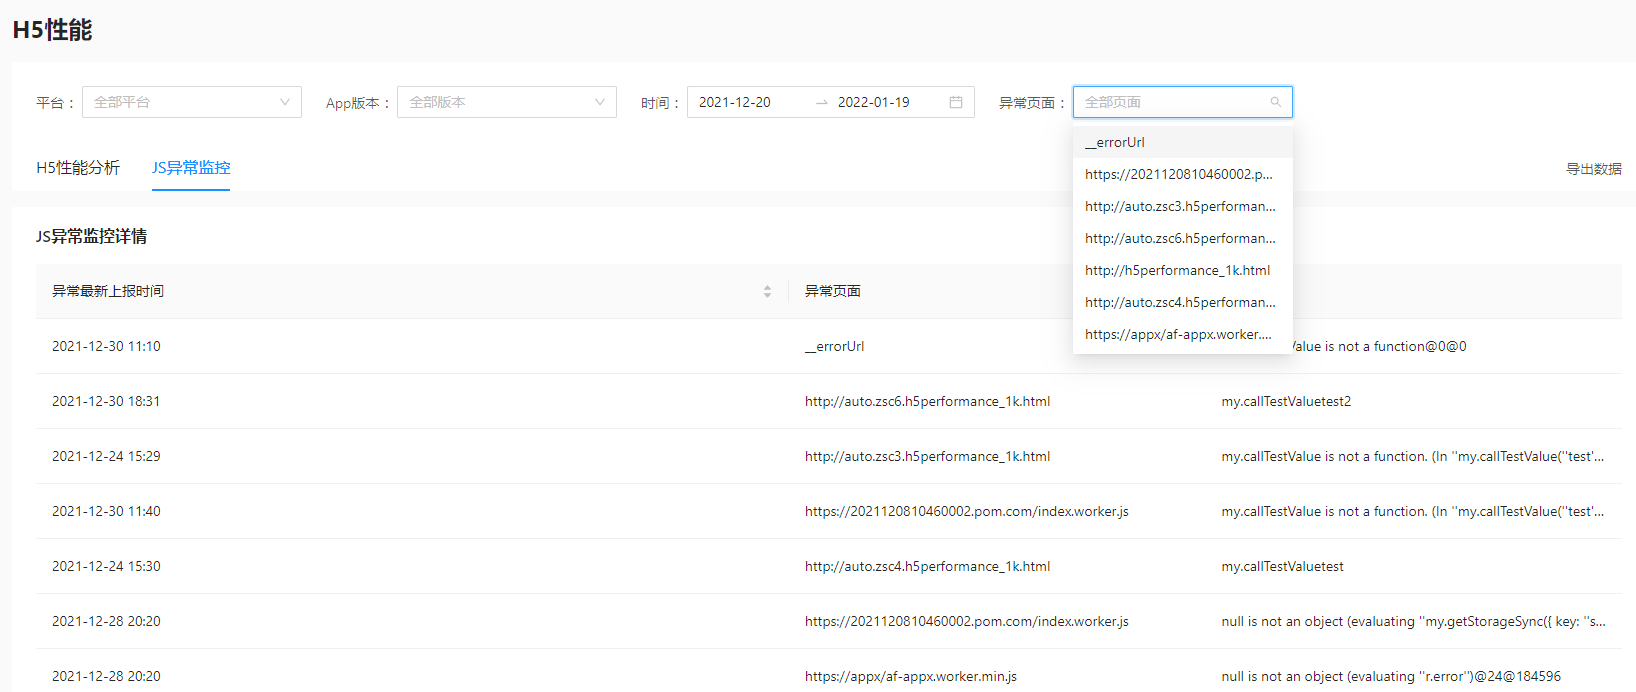
Field | Description |
Last report time | The most recent time a JS exception was reported for the page within the specified time range. |
Exception page | The page where the JS exception occurred. |
Exception details | The details of the JS exception on the page. |