View metrics and configure alert rules
After a workflow runs, you can view its metrics and configure alert rules to monitor workflow status from the CloudFlow console or the Cloud Monitor console. For example, you can send alerts when the number of failed executions reaches a specified threshold.
View metrics
View metrics in the CloudFlow console
Log on to the CloudFlow console. In the top navigation bar, select a region.
On the Workflows page, click the desired workflow.
On the workflow details page, click the Metrics tab. Set a time range to view the workflow's metrics for that period.
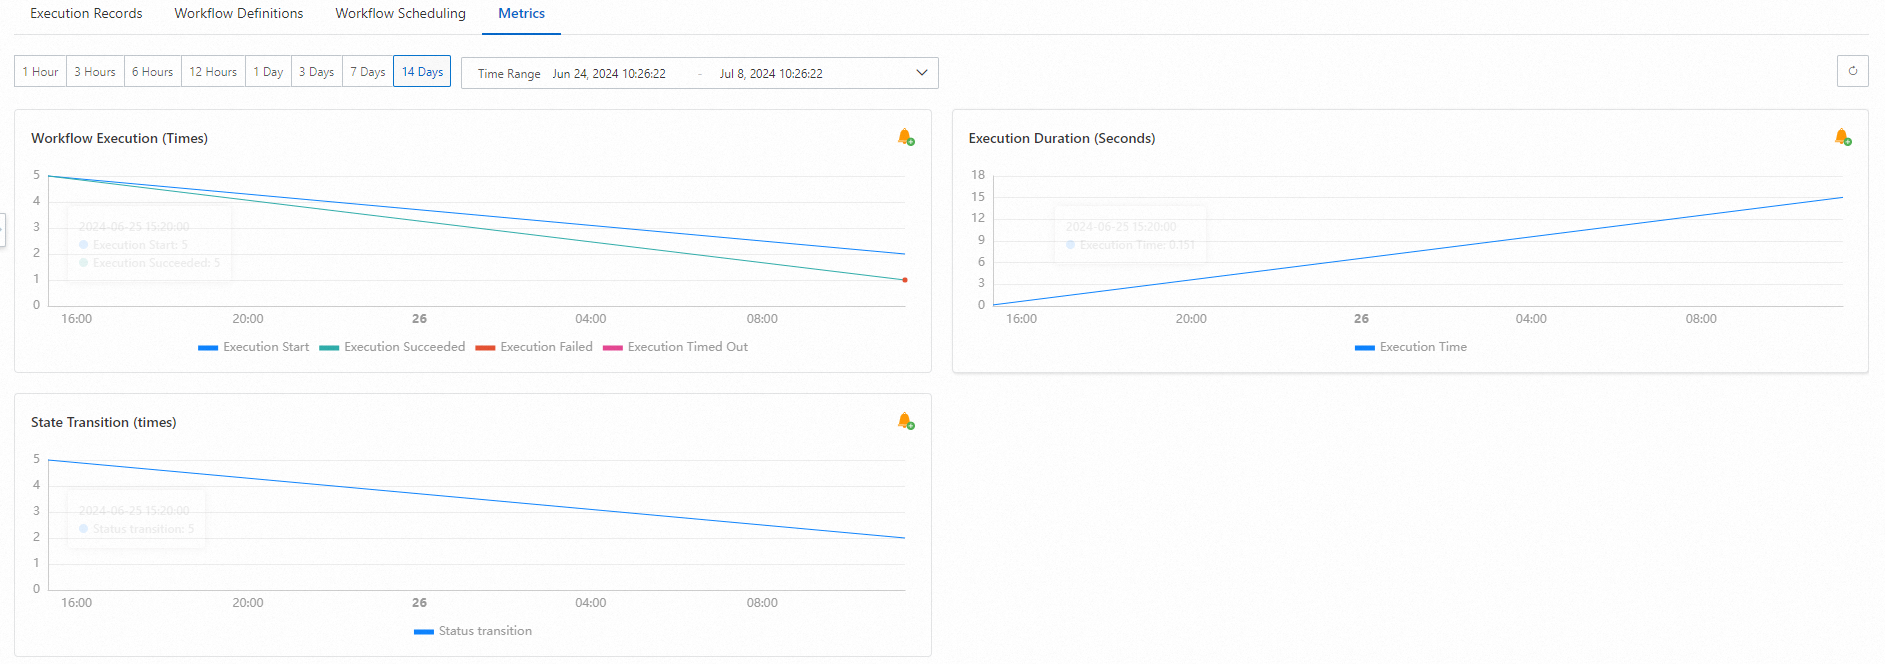
You can click the
 icon in the upper-right corner of a metric card to go to the CloudMonitor console and configure an alert rule. For more information, see Configure alert rules.
View metrics in the Cloud Monitor console
-
Log on to the Cloud Monitor console.
In the left-side navigation pane, click Cloud Service Monitoring. On the Cloud Service Monitoring page, search for and select CloudFlow.
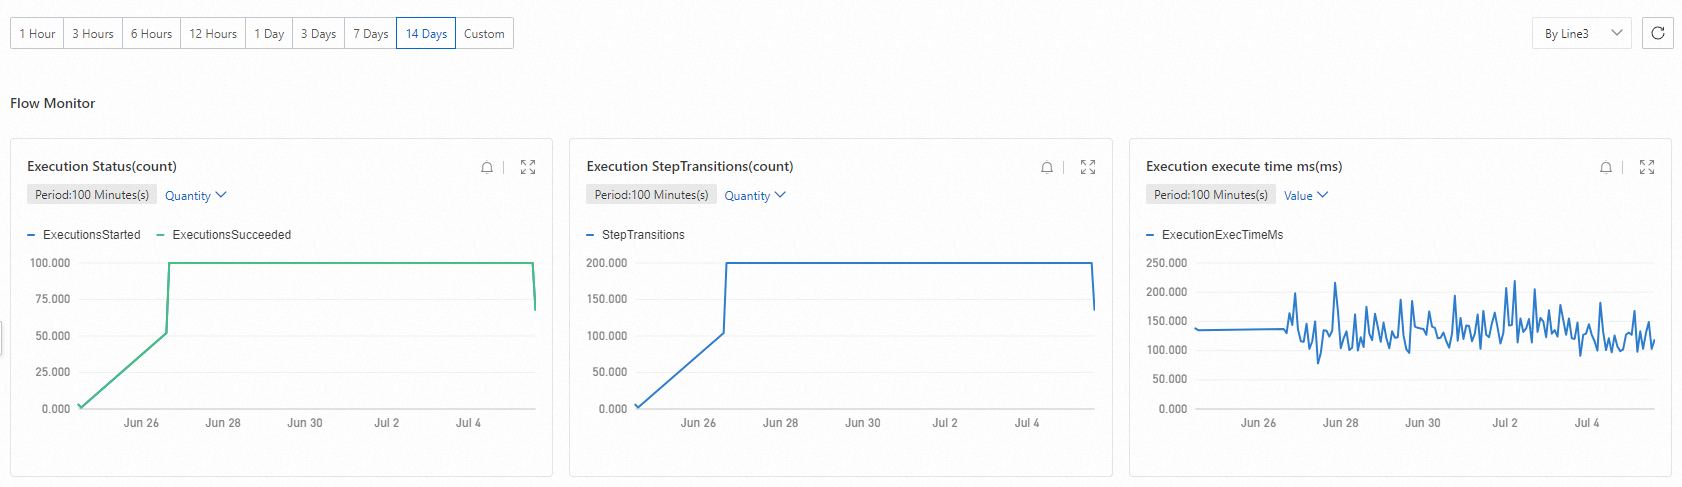
On the CloudFlow page, select a region, find the desired workflow, and click Monitoring Charts in the Actions column. Then, set a time range to view the workflow's metrics for that period.
Configure alert rules
Before you configure an alert rule, create an alert contact. For more information, see Create an alert contact.
-
Log on to the Cloud Monitor console.
In the left-side navigation pane, click Application Groups. On the Application Groups page, click Create Application Group.
In the Create Application Group panel, select Manually Create, set Application Group Name and Alert Contact Group, and then click OK.
By default, the Initialize and install the monitoring plug-in and Subscribe to event notifications switches are turned on.
After the group is created, you are redirected to the Group Resources tab of the new group.
Click + Manage Services and Resources. In the Add/Modify Group Resources panel, add CloudFlow, select a region, select the instance to monitor (the workflow name), and then click OK .
In the left navigation bar on the Application group details page, click Alert Rules, and then click +Create Alert Rule. In the Create Alert Rule panel, set Mute Period, Effective Period, and Alert Contact Group, click +Add Rule , and select a metric type, such as simple metric, composite metric, expression, or intelligent threshold.
In the Resource Range section, select All Resources, Application Group, or Instance. If needed, configure the Key and Value for Tags. In Advanced Settings, you can set the Alert Callback URL, select a Notification Channel (such as Auto Scaling, Log Service, Message Service (MNS) topic, or Function Compute), toggle the Recovery Notification switch, and choose a No Data Handling method, such as taking no action, sending an alert for missing data, or treating missing data as a recovery.
In the Set Rule Description panel, set the metrics and thresholds to monitor, and click OK.
The panel includes these settings: Rule Name (for example,
test-rule); Metric type, which includes Simple Indicators, Combined Indicators, Expression, and Dynamic Threshold; and Metrics, where you select a metric to monitor, such as workflow execution duration. The Threshold and Alert Level section has three levels: Critical (notifications sent via phone, SMS, email, and WebHook), Warning (notifications sent via SMS, email, and WebHook), and Info (notifications sent via email and WebHook). For each level, you can set the number of consecutive periods and the threshold condition, such as value ≥ 30 ms for 3 consecutive periods.Review your settings and click OK.
After the alert rule is configured, CloudMonitor sends a notification to the specified alert contacts when the trigger condition is met.