Session management
A session is a connection between an application and a database. You can use the session management feature to view tenant sessions, session statistics, and deadlock detection.
View tenant sessions
On the Tenant Sessions tab:
The proxy session ID is the session ID recorded by the database proxy.
The database session ID is the session ID recorded by the OBServer. It uniquely identifies a database connection on that OBServer.
The Tenant Sessions tab displays only current sessions. A proxy session can correspond to multiple database sessions, but only one is displayed. An active database session is displayed if one exists. Otherwise, a random database session is displayed.
Select the Only view active sessions check box to view only active sessions in the list. You can select multiple active sessions to set traffic limits in a batch.
NoteIf the Database for a selected session is No_database, you cannot set traffic limits in a batch because no database was specified during the connection.
Select the Aggregate sessions by SQL ID check box to group and display sessions that have the same SQL ID.
NoteAggregating by SQL ID helps you compare the traffic and resource consumption of different SQL IDs to identify the source of high resource consumption.
To select Aggregate sessions by SQL ID, you must first select Only view active sessions.
Select the Display sessions by aggregated IN check box to display sessions aggregated by IN SQL. This does not affect the statistics. You can select multiple active sessions to set traffic limits in a batch.
NoteAggregated IN SQL ignores the number of constant parameters in the IN clause of a SQL statement. It treats each IN clause as having only one constant parameter. The SQL statement is then parameterized according to this rule to calculate the SQL ID. SQL statements with the same SQL ID are grouped together.
You must select Aggregate sessions by SQL ID before you can select Display sessions by aggregated IN.
If the Database for a selected session is No_database, you cannot set traffic limits in a batch because no database was specified during the connection.
You can filter sessions by User and Database.
You can search for sessions by Proxy Session ID, Database Session ID, SQL ID, SQL, Source, Destination, or Database Node.
Sort sessions by Running Time (s) or CPU Time (s).
Click a SQL statement to open the SQL Execution Details page, where you can view the SQL text, optimization suggestions, and operator execution plan.
The SQL Execution Details page displays the execution plan and details of operators for SQL statements that meet one of the following conditions:
SQL statements that use the MONITOR hint
SQL statements that use hints related to parallel execution
Slow SQL statements (running time exceeds 5s)
 Note
NoteThe OBServer must be V4.0 or later.
For operators that execute quickly, performance statistics may not be displayed.
For more information about the MONITOR hint, see MONITOR Hint. For more information about hints related to parallel execution, see Hints related to parallel execution.
For other SQL statements, the SQL Execution Details page shows only the operator execution plan.
You can end the session.
To close a session, click Close Session in the corresponding Actions column.
To close multiple sessions, select the check boxes for the target sessions and click Batch Close Sessions at the bottom.
To close all sessions:
Select the check box next to Proxy Session ID and click Batch Close Sessions at the bottom.
Click Select All at the bottom and then click Batch Close Sessions.
NoteAfter closing the sessions, you can view the task status on the Optimization Management > Optimization Records page.
You can set traffic limits.
Individual rate limiting:
For the target session, in the Actions column, click Set Traffic Limit.
In the dialog box, enter a value for Maximum Concurrent Connections and click OK.
In the dialog box that appears, click OK.
To set traffic limits for multiple sessions in a batch:
Select the check boxes for the target sessions and click Batch Set Traffic Limits at the bottom.
In the dialog box, enter a value for Maximum Concurrent Connections and click OK.
In the dialog box that appears, click OK.
NoteAfter you set the traffic limits, you can view the task status on the Optimization Management > Optimization Records page.
If the Database for a selected session is No_database, you cannot set traffic limits in a batch because no database was specified for the connection.
View session statistics
On the Session Statistics tab:
You can view or export the number of active sessions and the total number of sessions for the current cluster by user, source, and database.
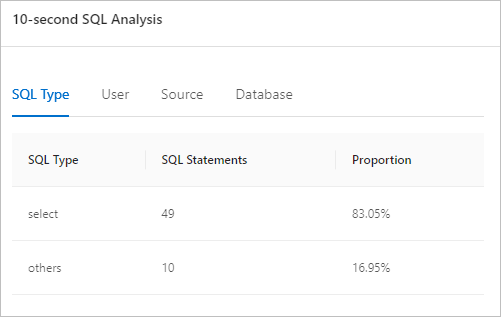
In the upper-right corner, click 10-Second SQL Analysis. You can view the SQL execution status within the tenant over the last 10 seconds, categorized by SQL Type, User, Source, and Database.
View deadlock detection
On the Deadlock Detection tab:
To use the deadlock detection feature for the first time, click Enable Deadlock Detection. When enabled, the system detects and handles deadlock events in real time. This feature introduces a performance overhead of about 2%. You should enable this feature based on the needs of your cluster.
NoteThe deadlock detection feature is available only in OceanBase 4.x.
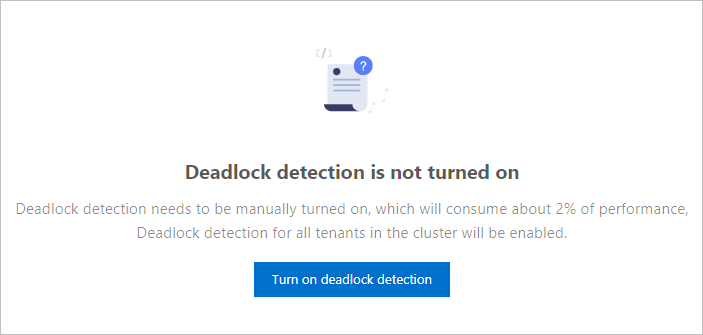
After you enable deadlock detection, the system diagnoses deadlocks in the cluster's tenants and provides the results in the Deadlock Details area. The results are retained for 7 days.
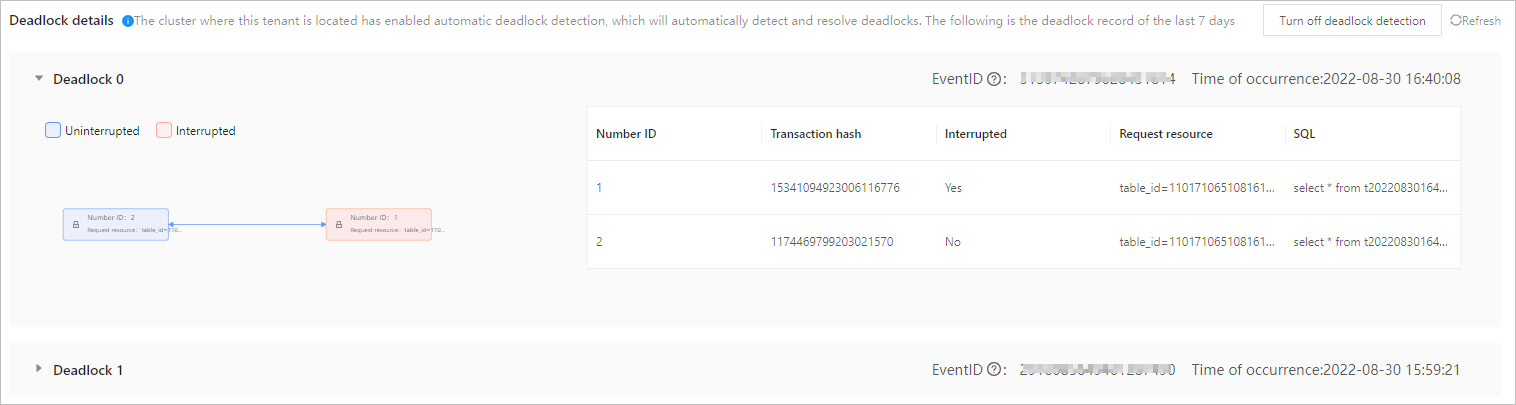
In the upper-right corner, click Disable Deadlock Detection to disable the deadlock detection feature, or click the refresh icon to refresh the deadlock details.